Summary
Ultrasound is a radiological technique that involves sending soundwaves with very high frequencies (∼ 2–20 MHz for diagnostic imaging) through the body and receiving their echoes to visualize internal structures and organs. The soundwaves are produced by piezoelectric transducers encased in a probe that also detects the echoes. The denser a material is, the stronger the echo and, accordingly, the intensity (brightness) of the structure visualized will be; the further the material is away from the probe, the longer the echo will take to return to the probe, plotting accordingly on the screen. Ultrasound can also be used endoscopically (e.g., transrectally, transvaginally, transesophageally, or transgastrically), to better evaluate internal organs and otherwise difficult to evaluate structures such as the prostate, ovaries, heart valves, and pancreas. The use of ultrasound contrast agents, which have very few side effects compared to radiocontrast agents, further expands the diagnostic applications of the modality. Ultrasound machines offer a variety of modes for different diagnostic purposes. Amplitude mode (A mode) is the most basic mode and employs a single transducer to plot echoing structures on a single axis as a series of peaks whose height reflects the depth of those structures; brightness-modulated mode (B mode or 2D mode) employs an array of transducers, producing a two-dimensional, grayscale image of the echoing structures that reflects density as well as the depth; motion mode (M mode) employs a sequence of pulses in rapid succession to generate a series of A or B mode images visualizing the motion of the echoing structures (e.g., the heart); and doppler or duplex mode takes advantage of the doppler effect, produced by shifting the frequencies of the ultrasound waves used, to visualize motion within structures, e.g., the velocity and direction of blood flow. Due to the safety of ultrasound waves and the portability ultrasound machines, low cost, and high availability of ultrasound machines, the modality is often used as a complementary tool in clinical diagnosis, especially in children and pregnant women. Another advantage is that ultrasound offers quick diagnosis for certain diseases (e.g., cholecystitis and acute right ventricular load). The main disadvantages of ultrasound are the training and skill required of the examiner, low resolution, and the common appearance of artifacts.
Technical background
Generation of ultrasound waves
- Ultrasound waves are high-frequency sound waves above the limit of human hearing (∼ 20 kHz); medical ultrasound employs frequencies ∼ 2–20 MHz)
- In medical devices, ultrasound waves are generated by piezoelectric transducers.
- Piezoelectric effect: the accumulation of an electric charge in certain solid materials (e.g., crystals) in response to deformation by mechanical stress; inversely, the application of an electric charge to such materials will induce their deformation.
- Medical ultrasound uses the inverse piezoelectric effect on lead zirconate titanate or polyvinylidene fluoride crystals to generate and record ultrasound waves.
Recording of ultrasound waves
- The rate at which tissue absorbs ultrasound waves is proportional to the frequency employed.
|
Low frequency (typically 3.5 MHz) |
High frequency (typically 7.5 MHz) |
|
|---|---|---|
| Absorption | Low | High |
| Resolution | ||
| Penetration depth | High | Low |
| Example when useful | Abdominal ultrasound | Thyroid ultrasound |
- The greater the density of a medium, the greater the intensity of the echo. The contrasting details of an ultrasound picture are created by the varying echo intensities created by different degrees of tissue density.
- The ultrasound waves generated by the transducer are also received by the transducer and then converted into electrical signals, which are then translated into an image and recorded.
- Spatial resolution is achieved by measuring the time intervals between echoing ultrasound waves.
- The reflected waves can be used to visualize morphology or assess motion (mostly the velocity of blood flow) using different recording techniques.
Acoustic windows [1][2]
-
Description
- Areas of the body that conduct ultrasound waves well and enable visualization of distal structures.
- Must be accessible by the transducer or ultrasound beam for optimal visualization of areas of interest
- Ultrasound conductivity: The ability of a medium to conduct ultrasound waves. [3]
| Ultrasound conductivity of different media | ||
|---|---|---|
| Medium | Conductivity | Clinical implications |
| Clear fluid (e.g., water, urine) Solid organs Soft tissue Ultrasound gel |
|
|
| Air |
|
|
| Bone |
|
|
| Fat |
|
|
Assessment of morphology
The reflection of ultrasound waves at the interfaces of tissues of different densities allows for the measurement of tissue echogenicity (corresponds to tissue density), while the return time allows for the determination of the distance between the structures visualized and the transducer (spatial distribution).
-
A-mode (amplitude mode)
- A one-dimensional visualization of structures based on the representation of echo amplitude (echogenicity) along the y axis and echo delay (depth) along the x axis.
- Original ultrasound modality that is rarely used today
-
B-mode/2D mode (brightness mode)
- A two-dimensional grayscale visualization of structures based on the representation of echo intensity by white dots of varying brightness depending on echogenicity of the structure. Image depth is represented by distance from transducer (top of the screen) based on the echo delay, while image width is represented by the combination of a series of ∼ 120 parallel images.
-
M-mode (motion mode)
- A B mode visualization of structures that represents motion within structures (e.g., heart valves) on a vertical axis
- Useful in assessing rapidly moving structures (used especially in echocardiography)
Assessment of direction of flow and velocity
-
Doppler mode
- Doppler ultrasound takes advantage of the doppler effect to visualize flow (e.g., blood) within structures by representing the compression and distention of soundwaves by the echoing structure rather than the echo delay.
- The higher the flow velocity (relative to the transducer), the stronger the compression or extension of the waves.
- Flow velocity is specified in m/s and visualized as changes in flow velocity (y axis) through time (x axis).
-
Pulsed wave Doppler (PW doppler)
- As in A-mode, B-mode, and M-mode, a piezoelectric element emits and receives ultrasound waves in pulses.
- Advantage of pulsatile, intermittent recordings: visualization of structure depth
- Disadvantage: limitations to temporal resolution
- As in A-mode, B-mode, and M-mode, a piezoelectric element emits and receives ultrasound waves in pulses.
-
Continuous wave Doppler (CW doppler)
- Two piezoelectric elements are used, in which one continuously emits and the other continuously receives.
- Advantage: High flow velocity (e.g., valve stenosis) can also be measured.
- Disadvantage: Spatial distribution of the reflecting structures is not possible.
- Two piezoelectric elements are used, in which one continuously emits and the other continuously receives.
Combined method: duplex ultrasonography
- Duplex ultrasonography is a combination of PW-Doppler and B-mode imaging that allows for visualization of morphology (e.g., vessels) and flow direction/velocity of moving structures (e.g., blood).
- Color duplex ultrasonography (also known as color flow mapping) provides color-coding of flow direction (red = towards the transducer, blue = away from the transducer) and flow rate (the brighter the color, the faster the flow rate). Motionless structures are represented in grayscale according to echogenicity.
Technique/steps
-
Advantages
-
Ultrasound waves have no known harmful effects (compared to modalities using ionizing radiation)
- Can be employed with no known risk to children and pregnant women as a potential alternative to x-ray and CT
- Noninvasive
- Enables real-time morphological and functional (moving image) diagnostics in various clinical settings
-
Ultrasound waves have no known harmful effects (compared to modalities using ionizing radiation)
-
Disadvantages
- The quality and diagnostic value of an ultrasound image depend strongly on the skill of the examiner.
- Artifacts
-
Acoustic shadow
- If ultrasound waves are strongly absorbed and echoed at the surface, the waves will fail to penetrate the tissue. All structures behind the surface will appear black.
- Demarcation of the structures is not possible.
- Especially relevant in the depiction of structures superimposed by bones (spleen or kidney posterior to the ribs) or air (intestinal loops, pancreas)
- Acoustic enhancement: Because ultrasound waves are hardly weakened in fluids, structures that are located behind fluid-filled spaces will appear hyperechoic (brighter) in B-mode.
-
Reverberation: reverberation artifacts
- Multiple echoes that arise at strongly reflecting surfaces that are reflected back and forth at regular intervals, also behind the surface
-
Acoustic shadow


Ultrasound modalities
| Comparison of ultrasound modalities | ||||
|---|---|---|---|---|
| Conventional ultrasound | Duplex ultrasonography | Endoscopic ultrasound | Contrast-enhanced ultrasound | |
| Characteristics |
|
|
|
|
| Selected indications | Assessment/detection of:
|
Assessment/detection of:
|
|
|
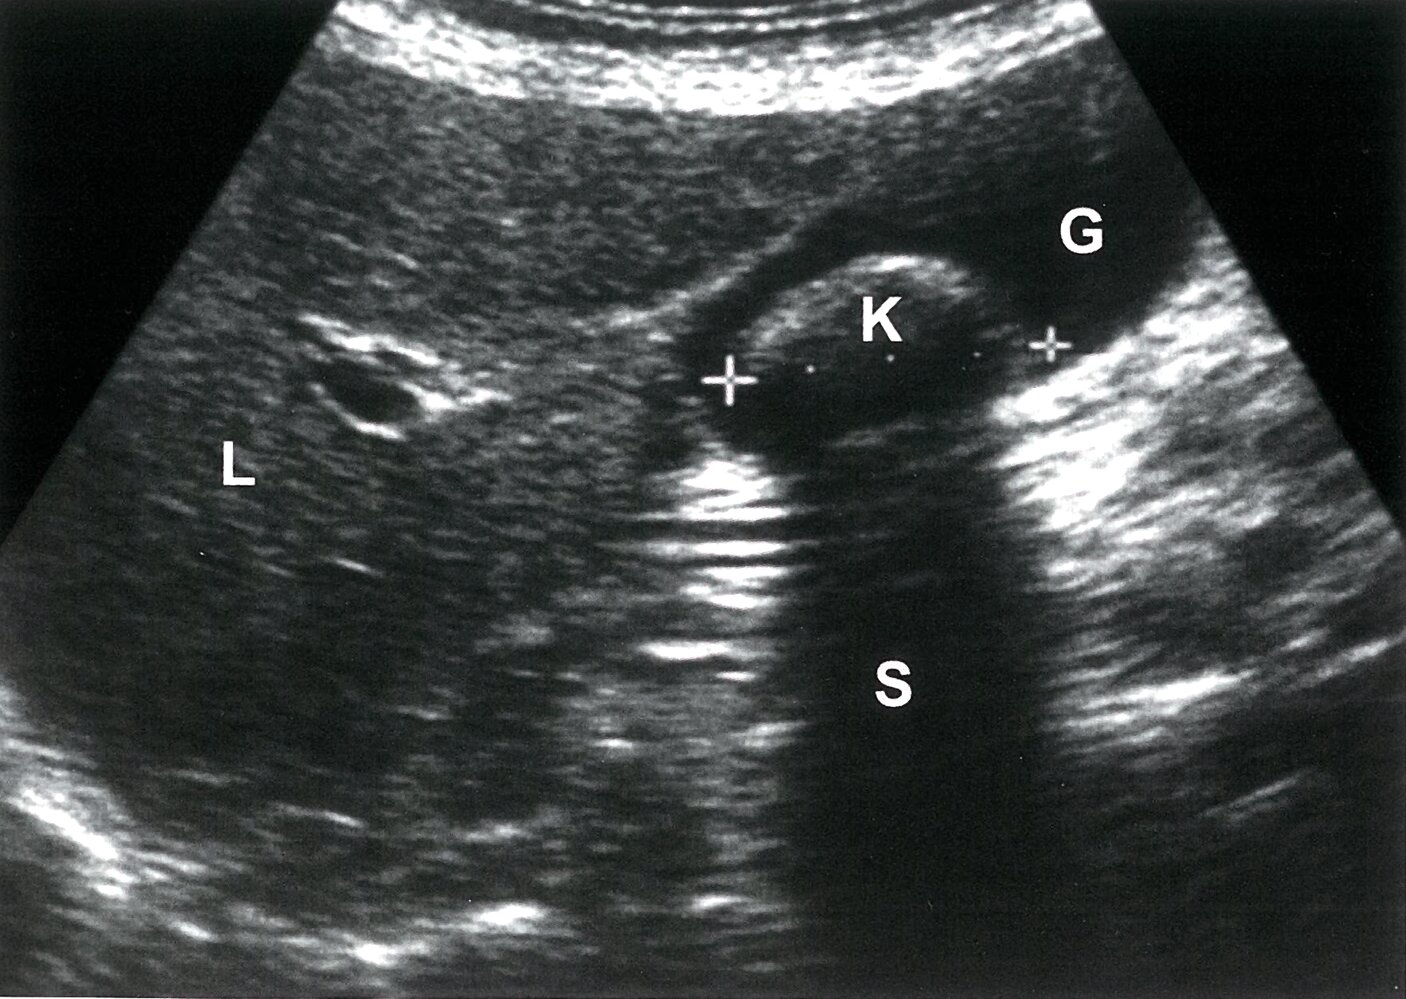
Ultrasound right upper quadrant (oblique plane)
A solitary calculus (K) in the dependent gallbladder (G) has a reflective anterior surface (green overlay) and casts a posterior acoustic shadow (S; green hatched overlay).
Characteristic ultrasound findings of cholelithiasis include a reflective anterior surface, marked posterior acoustic shadowing, and movement during repositioning of the patient.
L: liver
Source: © IMPP
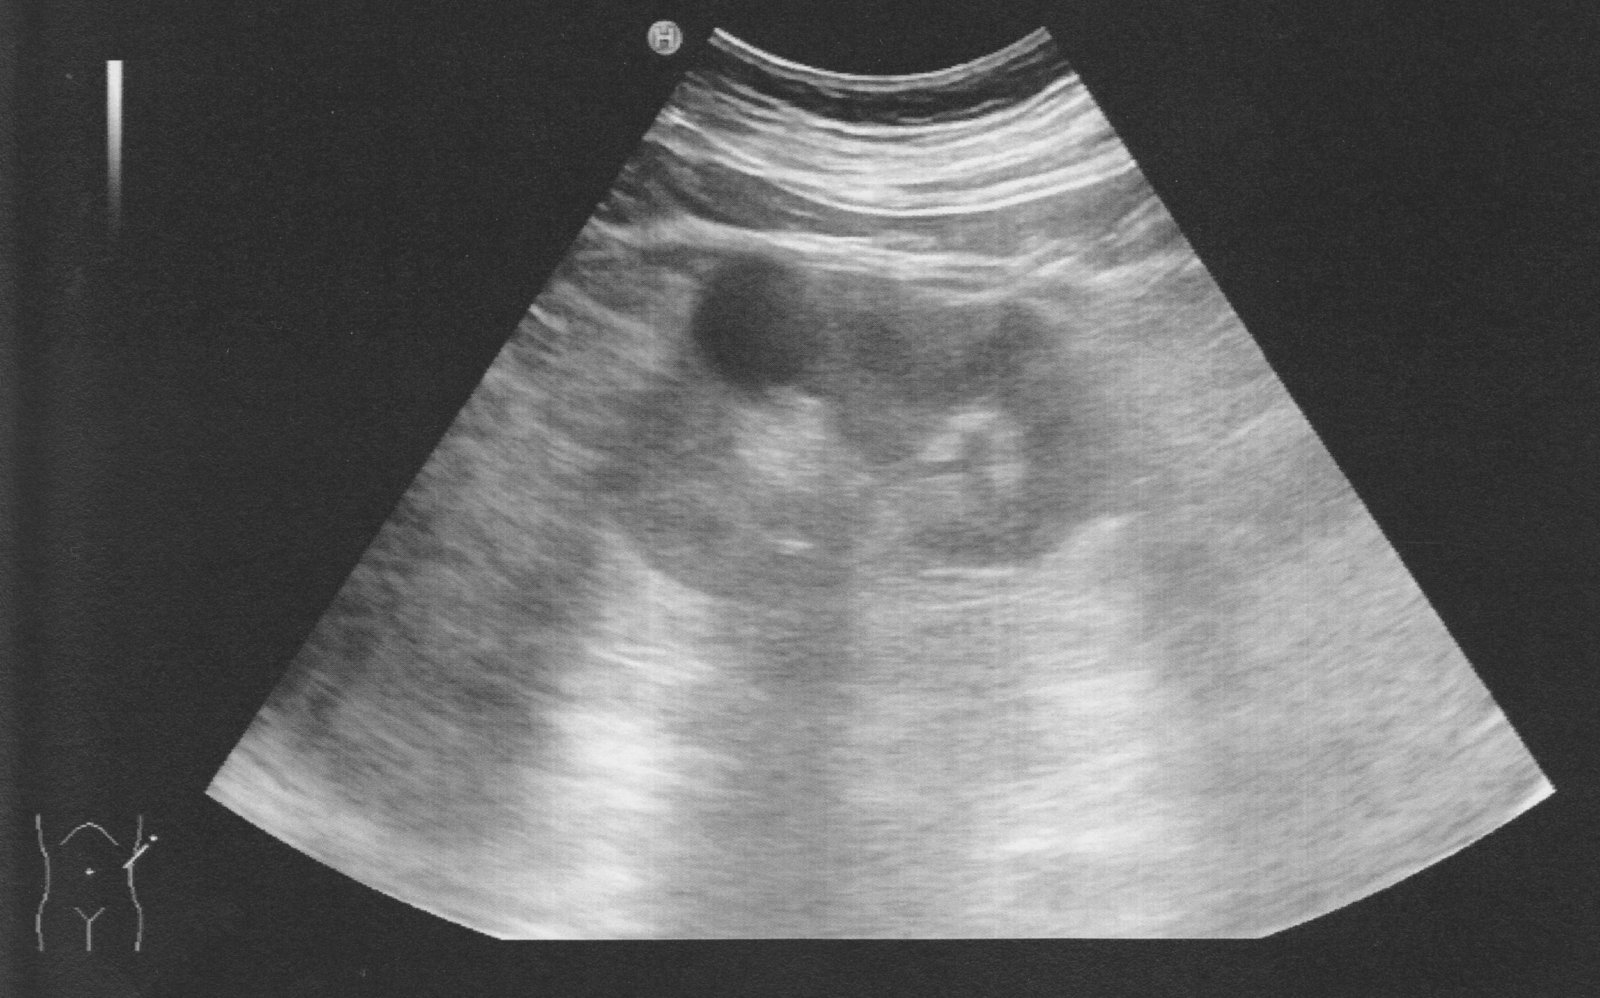
Ultrasound of left kidney
There is a thin-walled, anechoic lesion (green overlay) protruding from the renal cortex. There is posterior acoustic enhancement (green hatched overlay) with hypoechoic edge shadow on either side, indicating this lesion is fluid-filled. The renal capsule is demarcated by a green line.
These findings are consistent with a renal cyst.
K: Kidney; C: Cyst
© AMBOSS
Interpretation/findings
Conventional ultrasound
CNS (neonatology)


Thyroid

Thoracic organs


Abdominal organs


Kidney and urinary tract


Female sex organs and pregnancy


Musculoskeletal system

Duplex ultrasonography


Endoscopic ultrasound


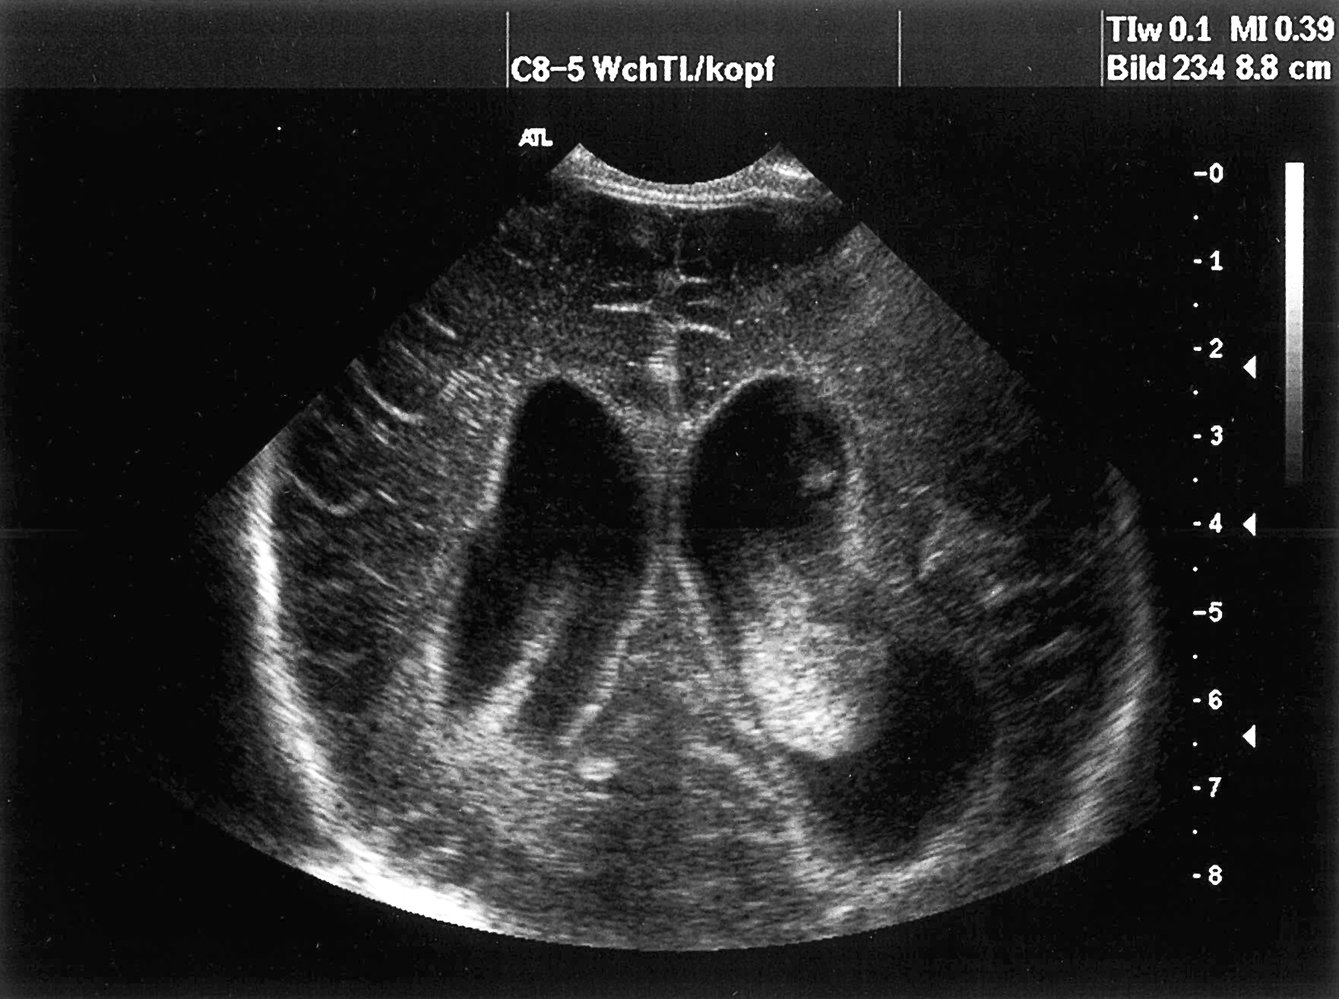
Ultrasound of the CNS, coronal section: dilated lateral ventricles with hyperechoic deposits that are compatible with intraventricular hemorrhage (green areas). (Arrow = periventricular calcification)
Source: © IMPP
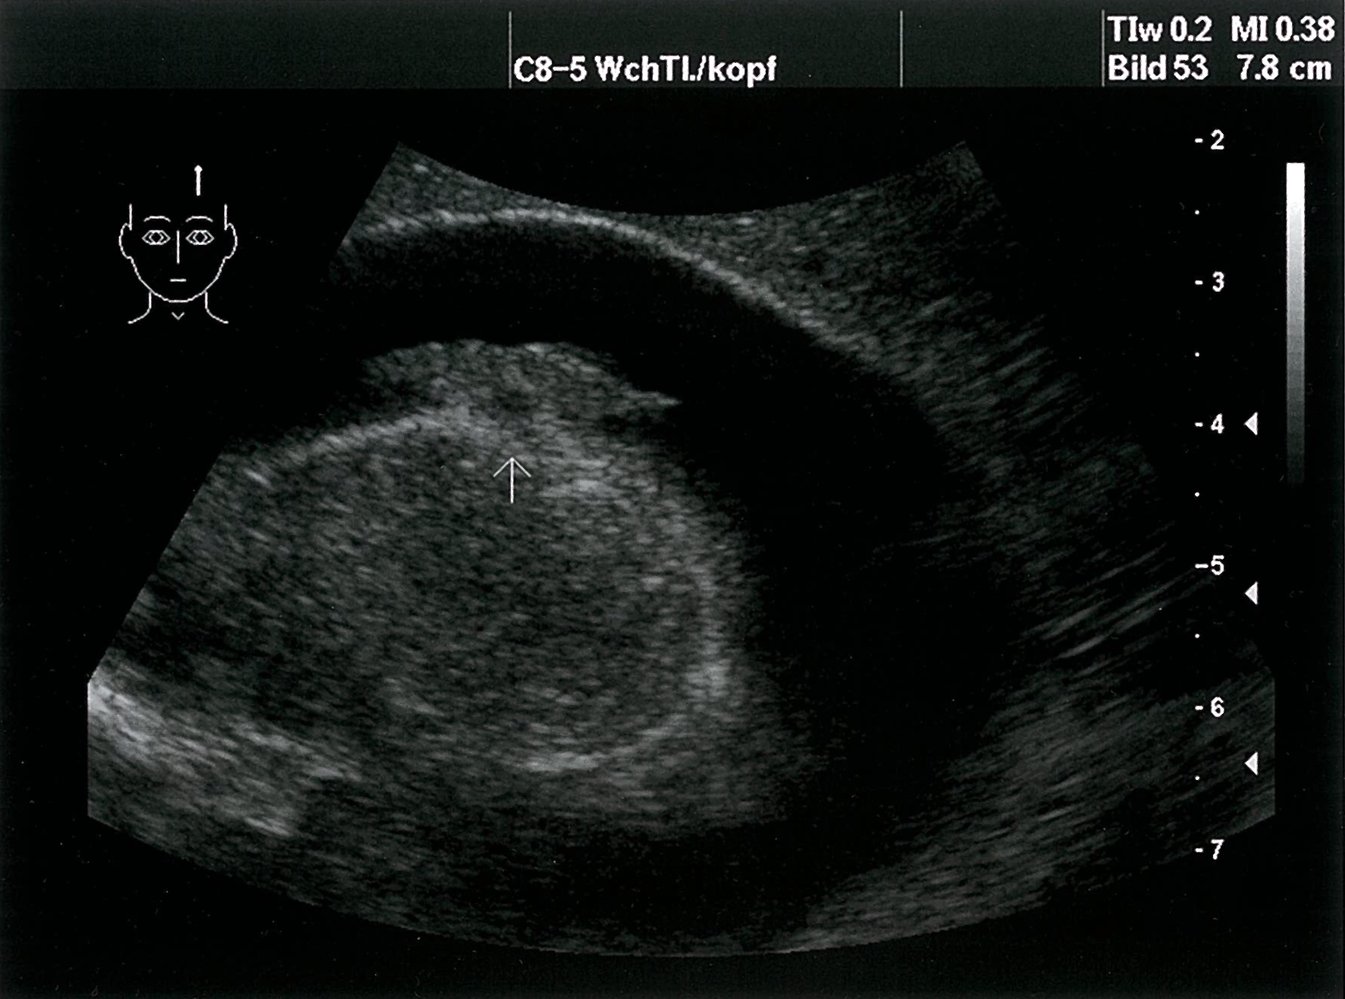
Ultrasound of the CNS, parasagittal section: dilated lateral ventricles with hyperechoic deposits that are compatible with intraventricular hemorrhage
Source: © IMPP
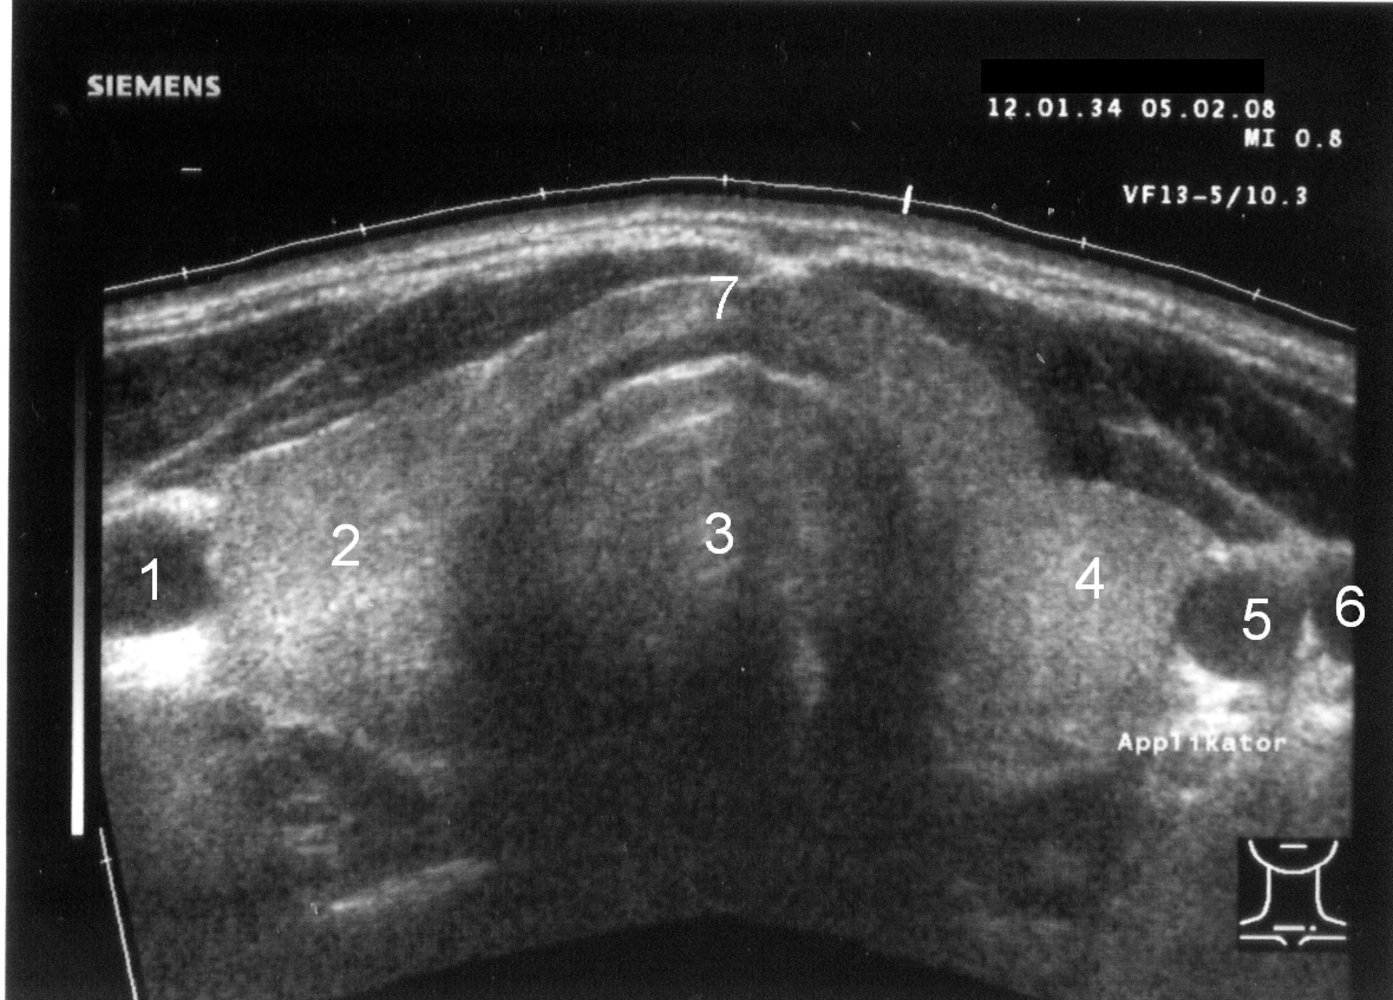
Ultrasound thyroid (transverse plane)
Normal image of the thyroid gland at the level of the isthmus.
1: right common carotid artery; 2: right lobe; 3: trachea; 4: left lobe; 5: left common carotid artery; 6: left jugular vein; 7: isthmus
Source: “SD-Sono001-Nummern” by Drahreg01, Wikimedia Commons, licensed under CC BY-SA 3.0.

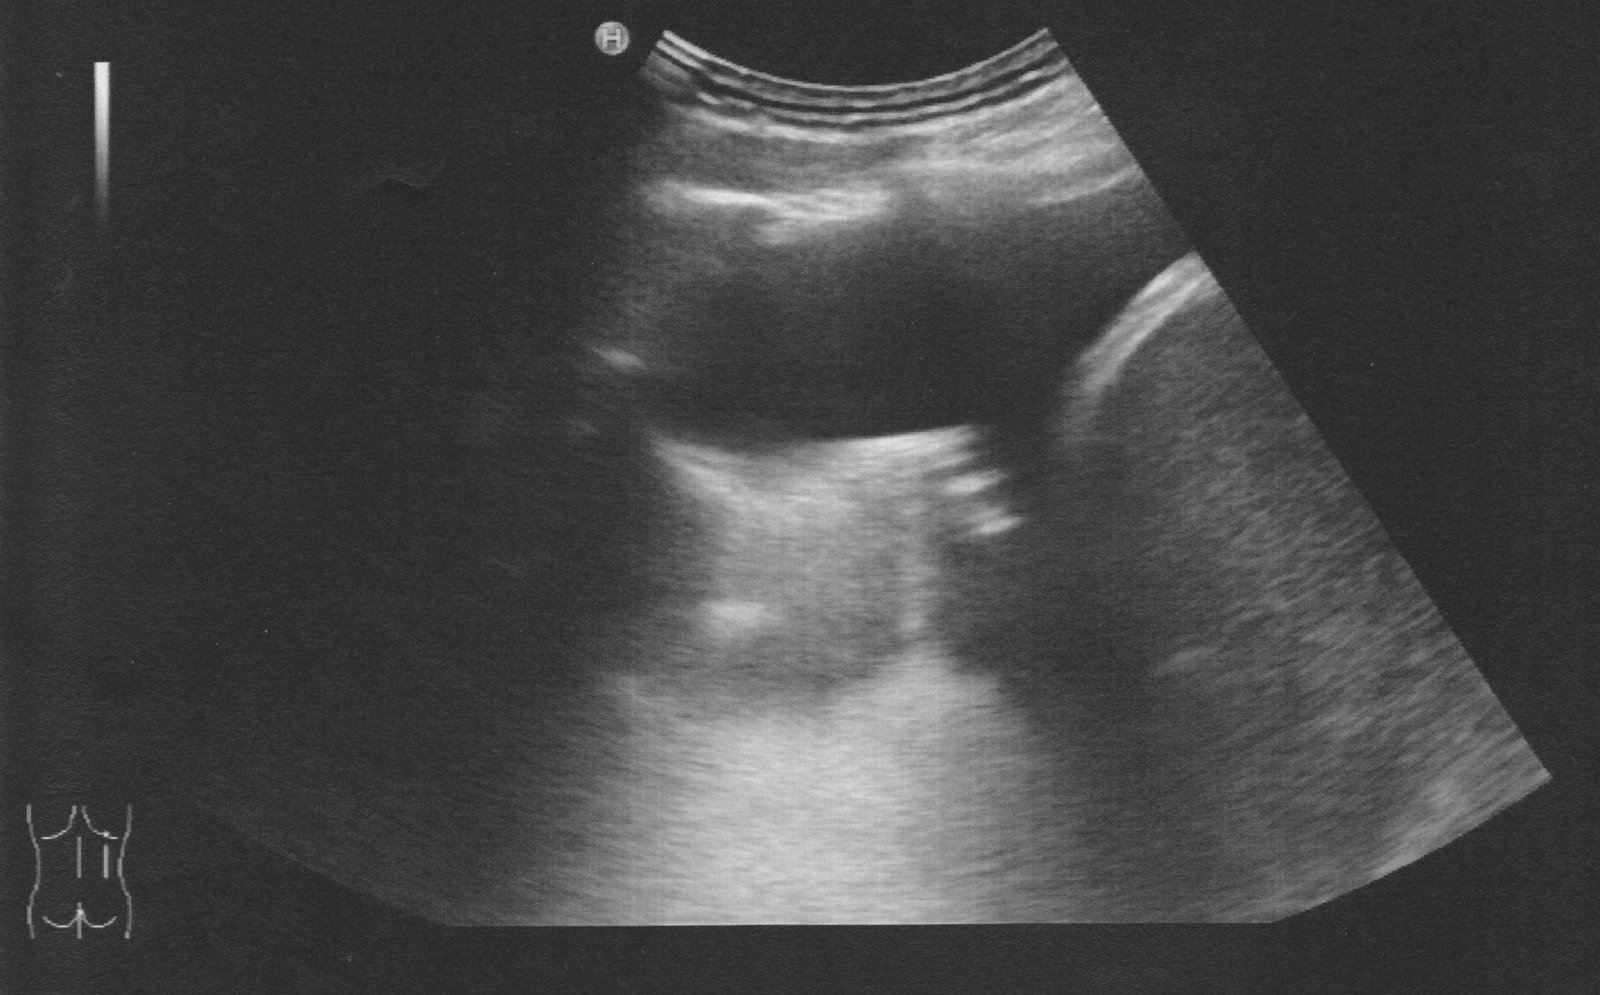
Ultrasound chest (posterior right hemithorax)
Anechoic fluid (green overlay; F) is visible in the costodiaphragmatic recess between the right hemidiaphragm (D) and atelectatic lung (Lu).
Li: liver
© AMBOSS
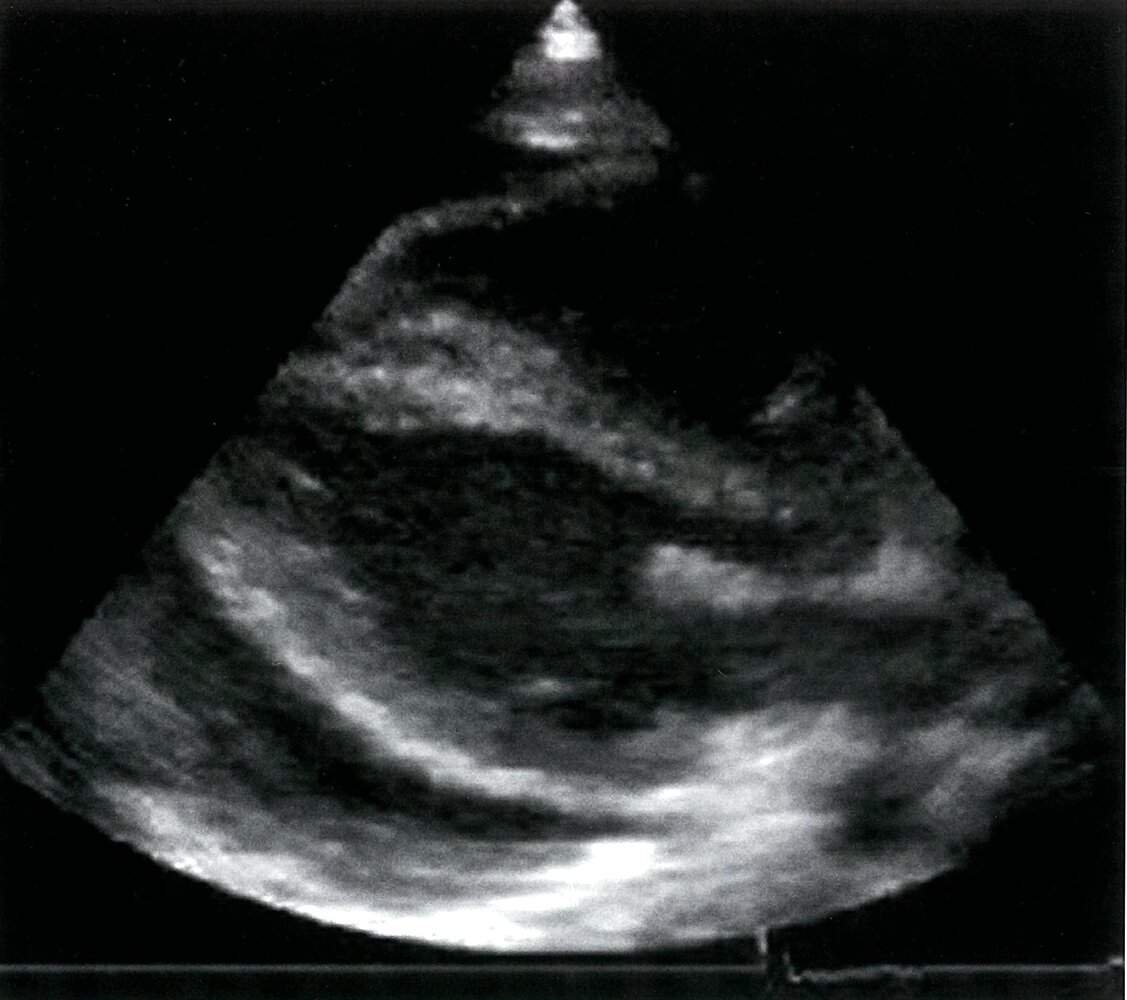
Echocardiography (transthoracic; parasternal long axis)
The image was taken in ventricular diastole with the mitral valve (M) open. Anechoic pericardial effusion (green overlay) surrounds the heart.
LV: left ventricle; RV: right ventricle
Source: © IMPP
Ultrasound right upper quadrant (oblique plane)
A solitary calculus (K) in the dependent gallbladder (G) has a reflective anterior surface (green overlay) and casts a posterior acoustic shadow (S; green hatched overlay).
Characteristic ultrasound findings of cholelithiasis include a reflective anterior surface, marked posterior acoustic shadowing, and movement during repositioning of the patient.
L: liver
Source: © IMPP
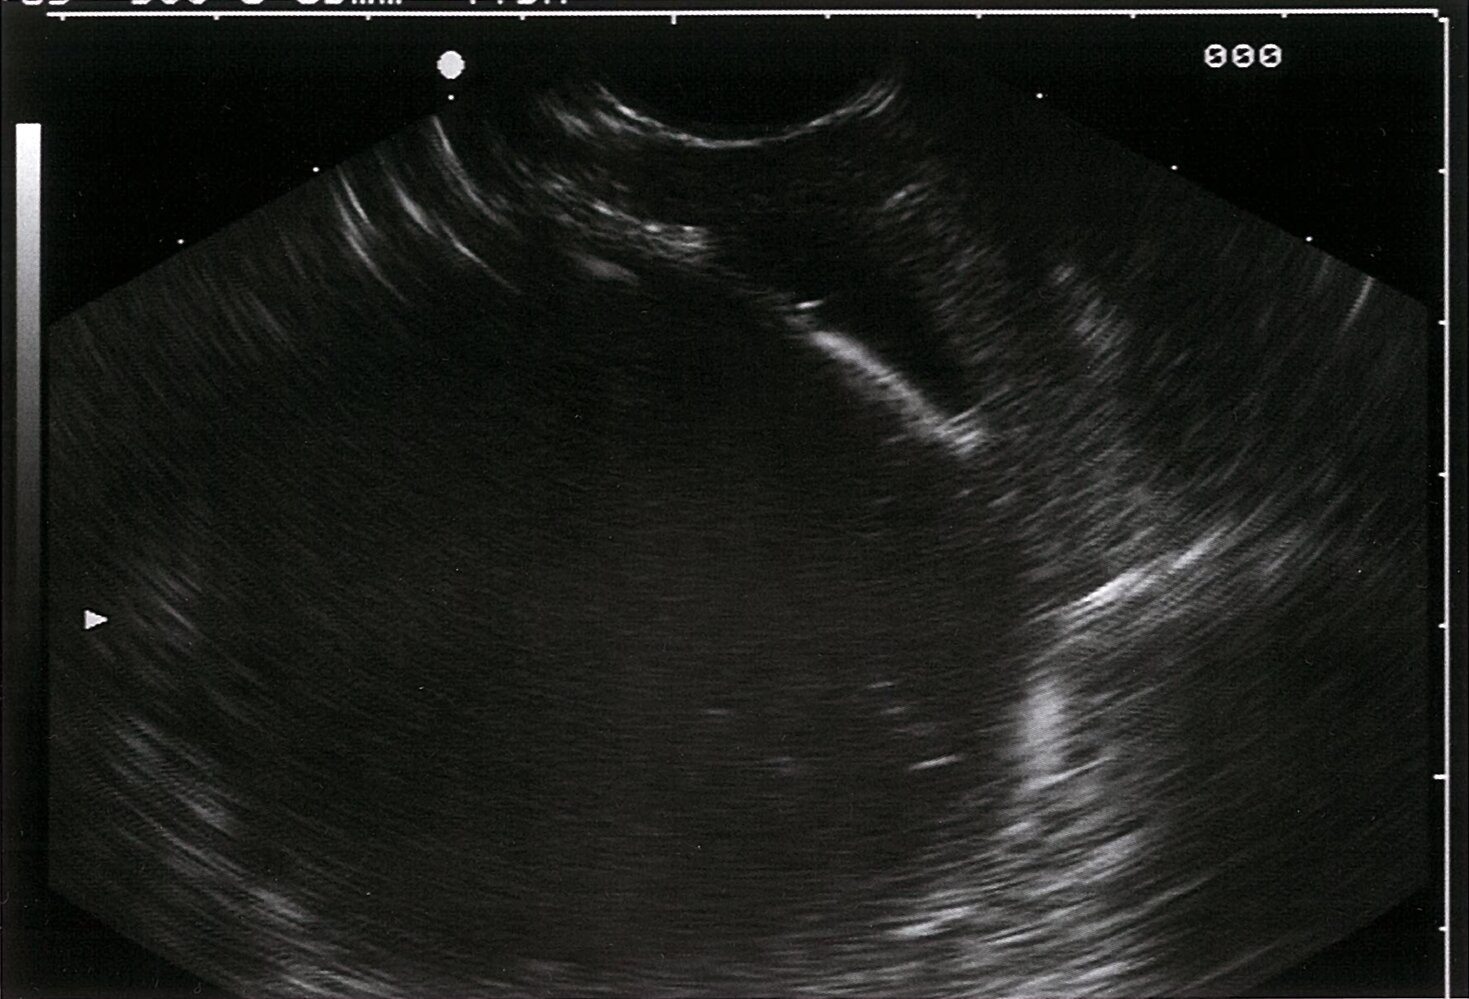
Ultrasound abdomen of a patient with a history of pancreatitis
Targeted image shows a rounded, predominantly anechoic lesion (green overlay) with a few internal echoes and posterior acoustic enhancement (yellow overlay). Adjacent pancreas (P) tissue is visible.
P: pancreas
Source: © IMPP
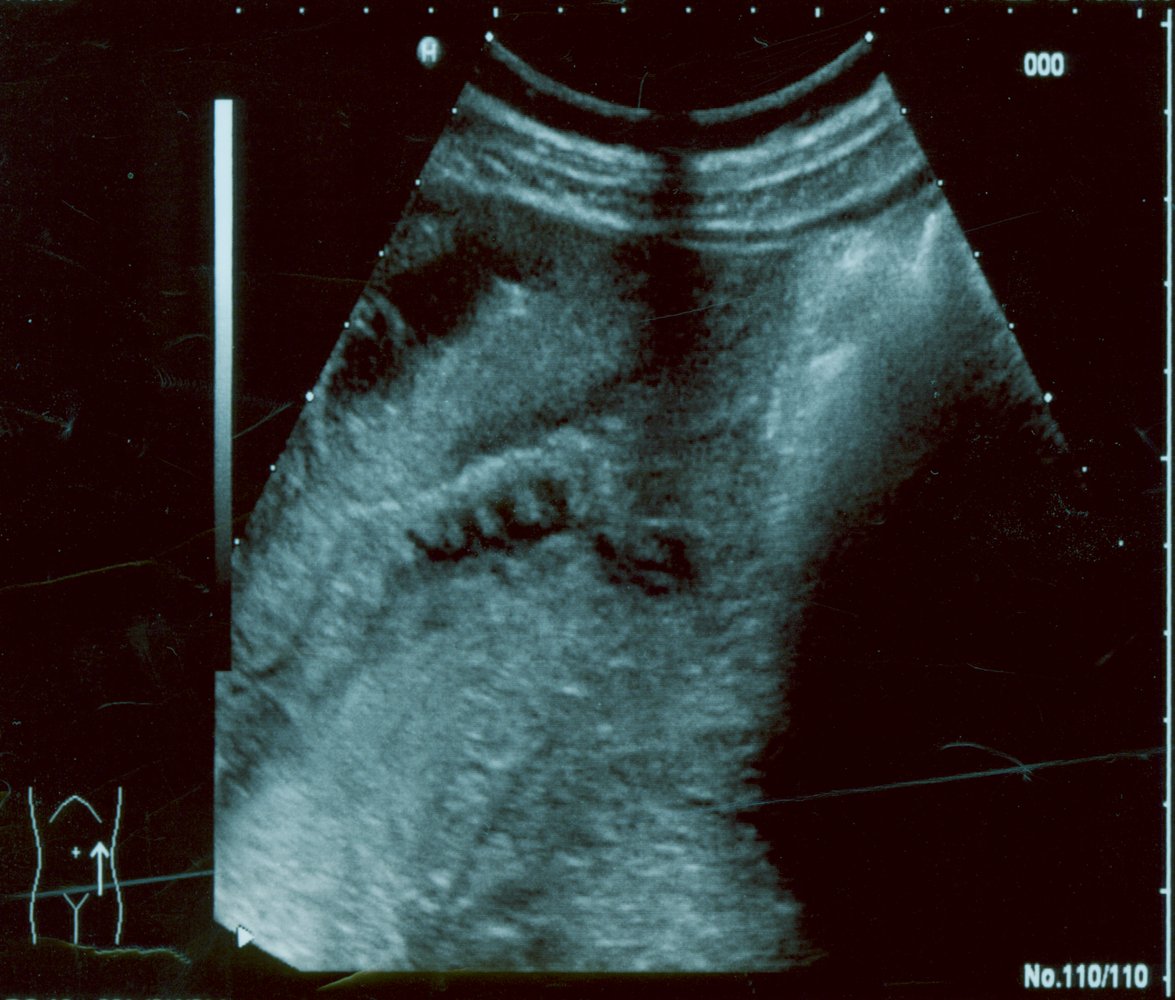
Abdominal ultrasound: keyboard sign indicating mechanical obstruction.
© AMBOSS
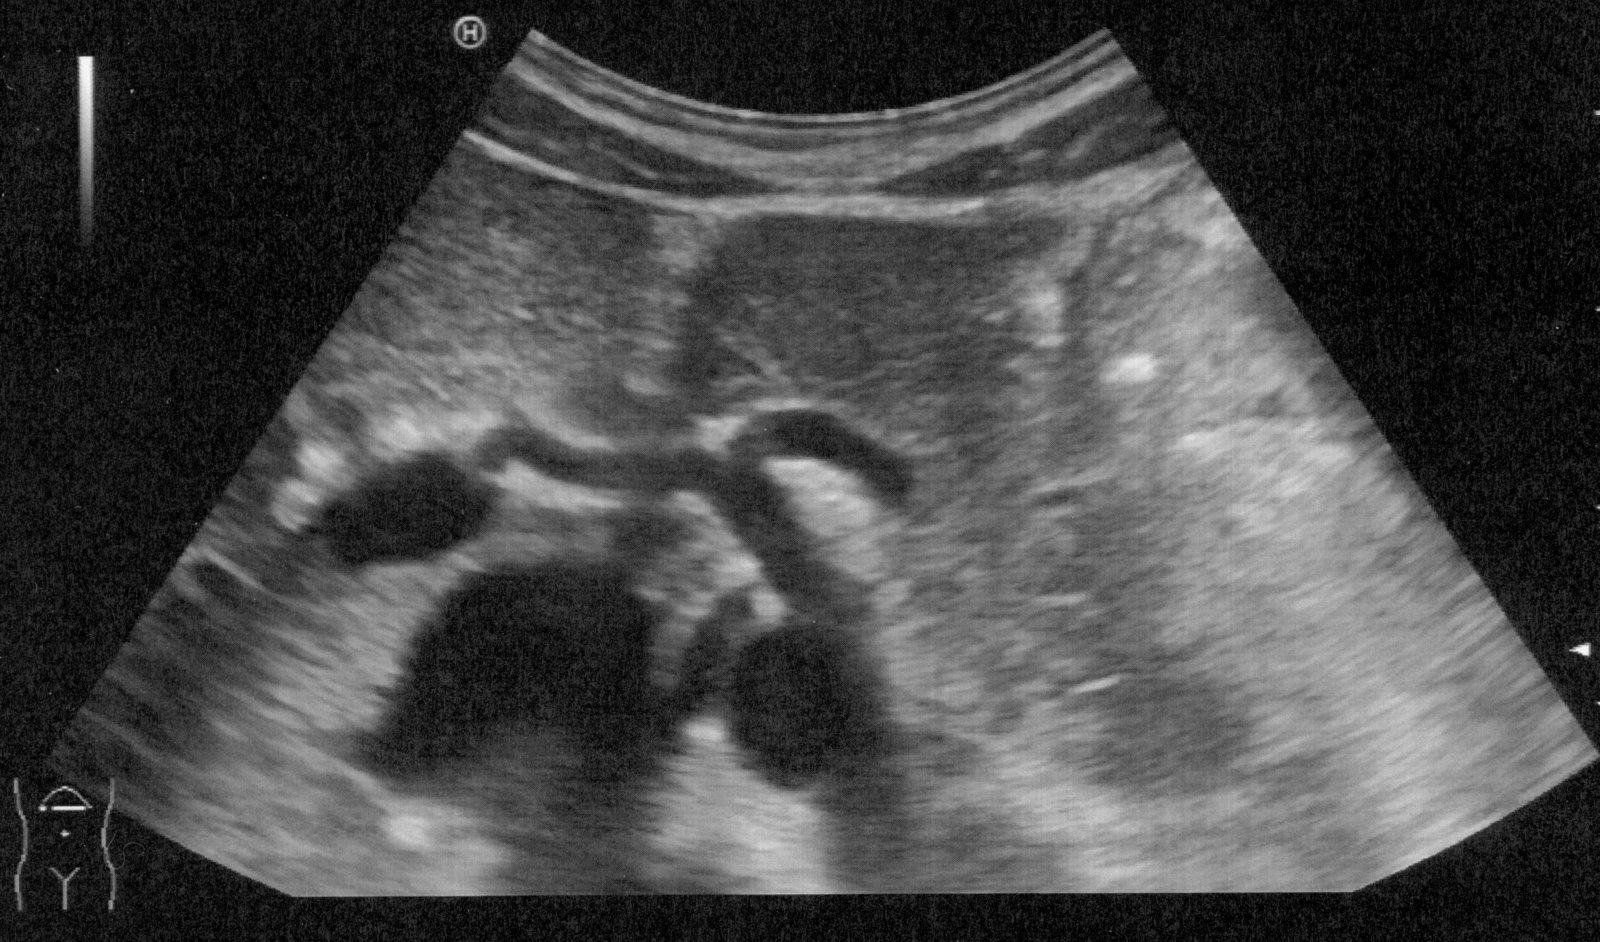
Transverse upper abdominal ultrasound
The celiac trunk (CT) gives rise to three vessels after branching from the aorta (A). In this image, only two of the three vessels are visible: the common hepatic artery (CHA) and splenic artery (SA). The left gastric artery is not shown.
P: portal vein; VC: vena cava; L: liver
© AMBOSS
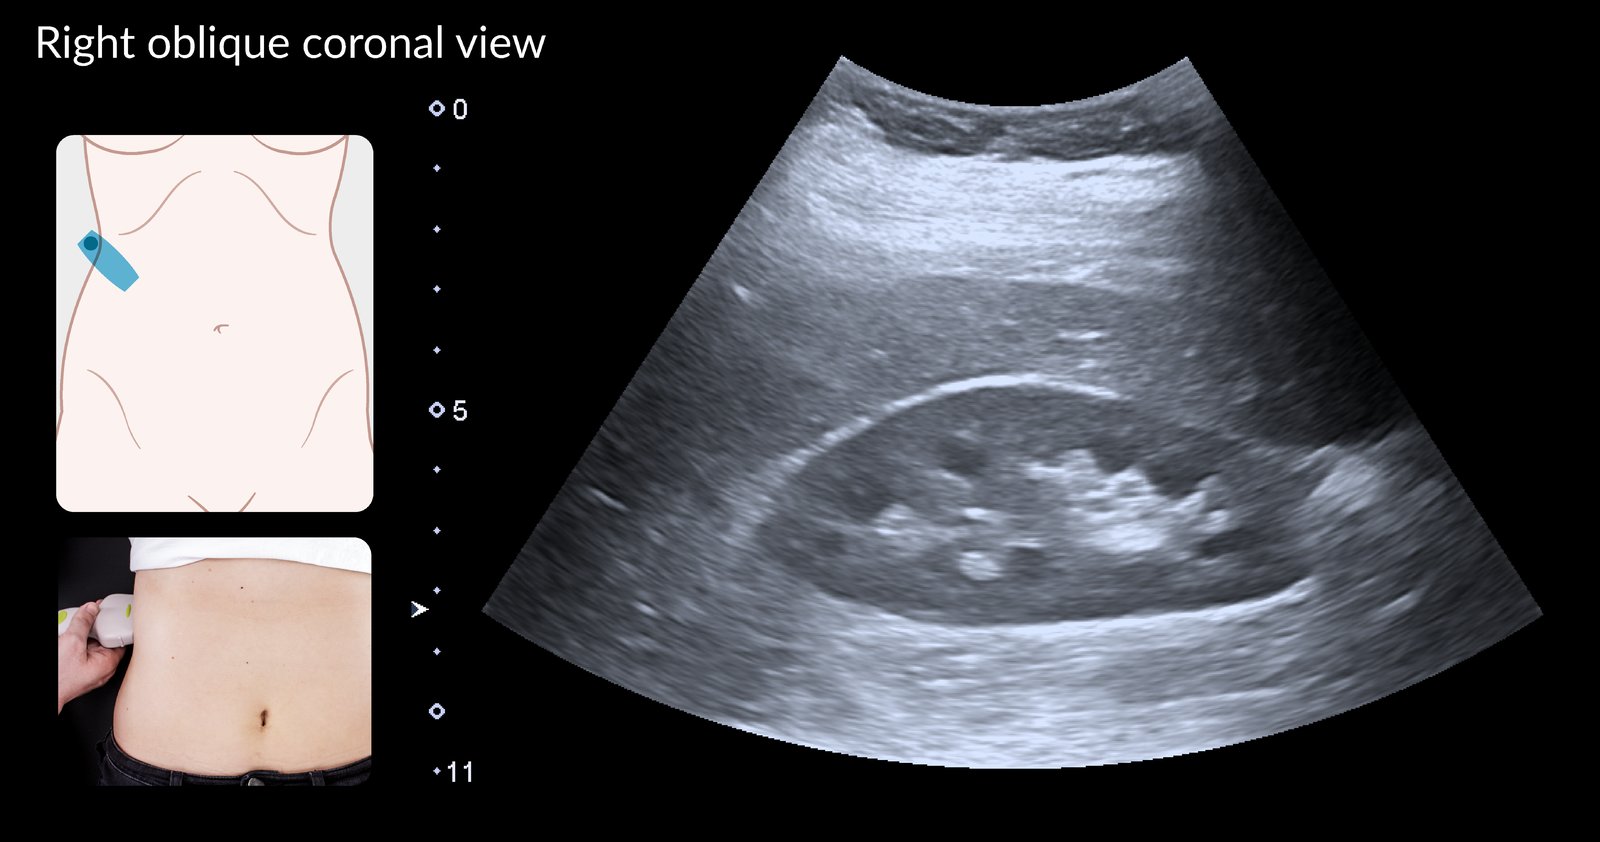
Ultrasound right kidney (imaged from the flank; coronal plane)
The right kidney (blue overlay) is seen as an oval structure deep to the edge of the liver (4). The hyperechoic central sinus echo complex (3) includes the renal pelvis, calyces, fat, blood vessels, lymphatics, and nerves. The more hypoechoic surrounding renal parenchyma is divided into the cortex (1) and medullary pyramids (2).
© AMBOSS
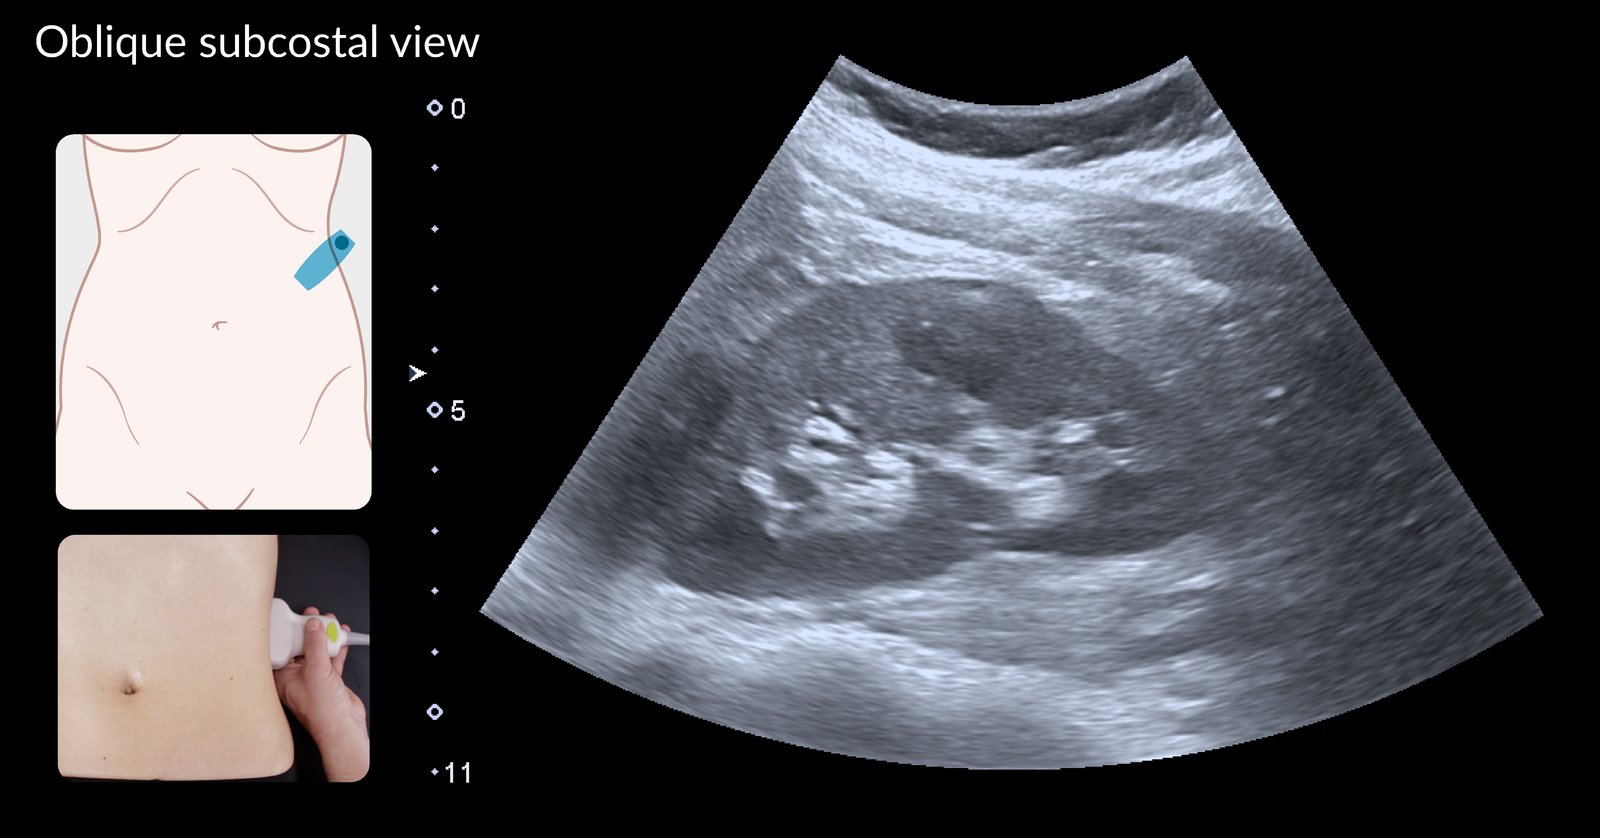
Ultrasound left kidney (imaged from subcostal approach; coronal plane)
The left kidney (blue overlay) is seen as an oval structure. The hyperechoic central sinus echo complex (3) includes the renal pelvis, calyces, fat, blood vessels, lymphatics, and nerves. The more hypoechoic surrounding renal parenchyma is divided into the cortex (1) and medullary pyramids (2).
© AMBOSS
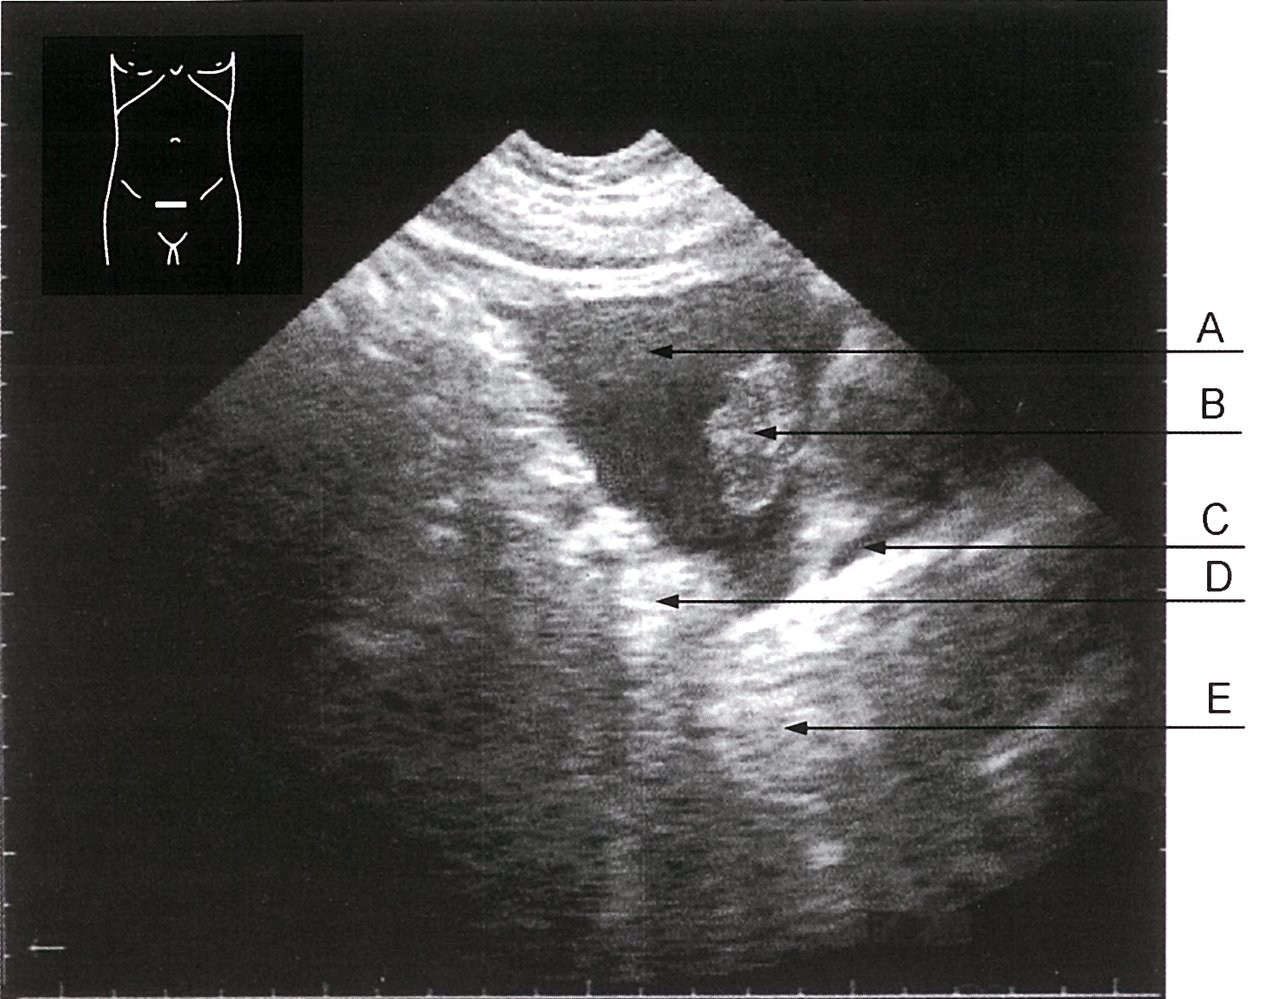
Ultrasound, transversal section of the bladder
A: hypoechoic bladder content (urine)
B: papillary urothelial carcinoma
C: thin, hypoechoic structure, likely to be the filled seminal vesicle or vessels
D: hyperechoic structure, likely to be the enlarged wall of the bladder or fat tissue
E: hyperechoic structure below the bladder (prostate gland)
Source: © IMPP
Ultrasound of left kidney
There is a thin-walled, anechoic lesion (green overlay) protruding from the renal cortex. There is posterior acoustic enhancement (green hatched overlay) with hypoechoic edge shadow on either side, indicating this lesion is fluid-filled. The renal capsule is demarcated by a green line.
These findings are consistent with a renal cyst.
K: Kidney; C: Cyst
© AMBOSS
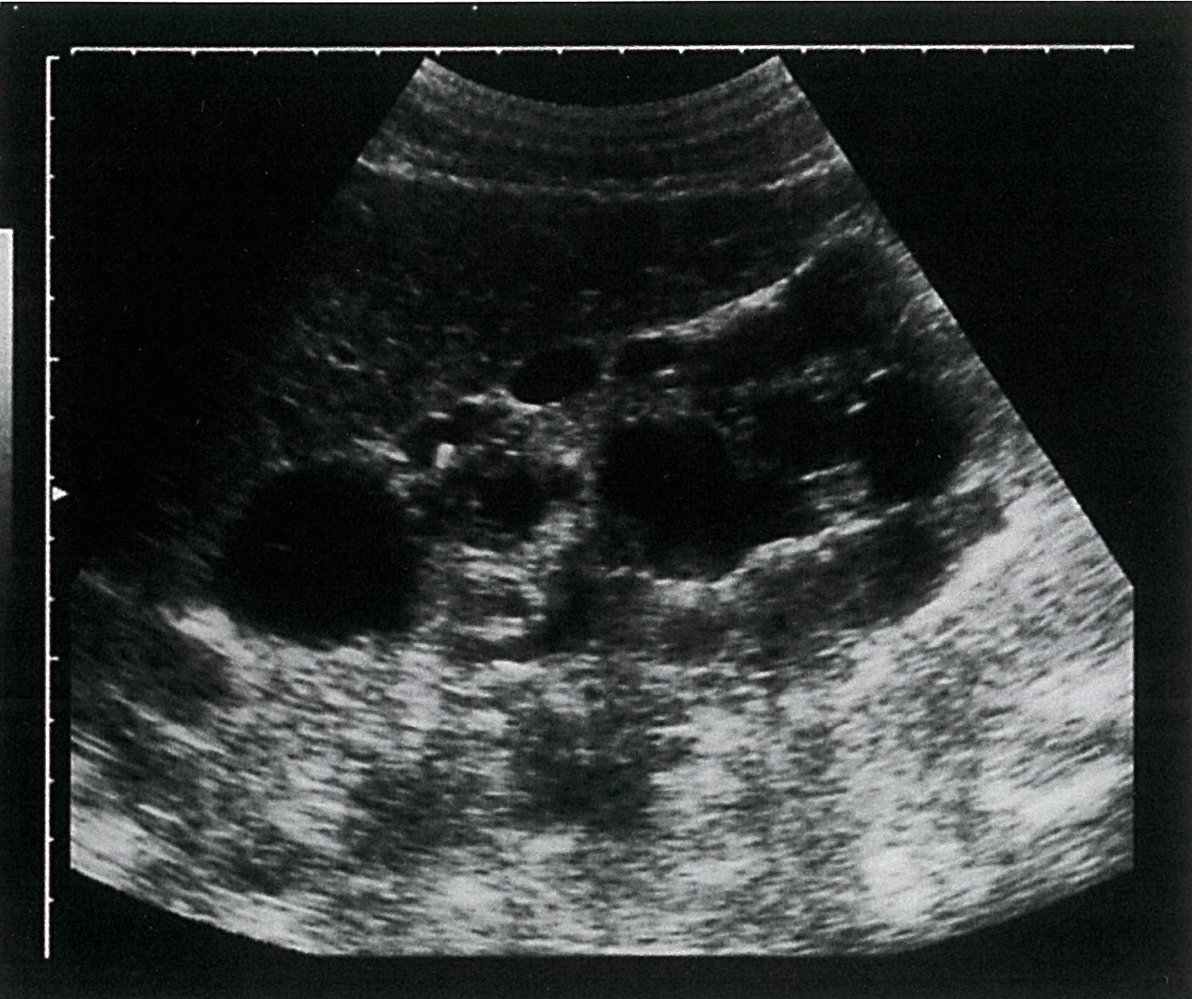
Ultrasound right kidney (longitudinal view)
The right kidney is enlarged with multiple anechoic lesions of variable sizes (solid green overlay). There are hyperechoic regions of acoustic enhancement (striped green overlay). Part of the liver is also seen.
These findings are consistent with polycystic kidney disease.
K: Kidney; L: Liver
Source: © IMPP
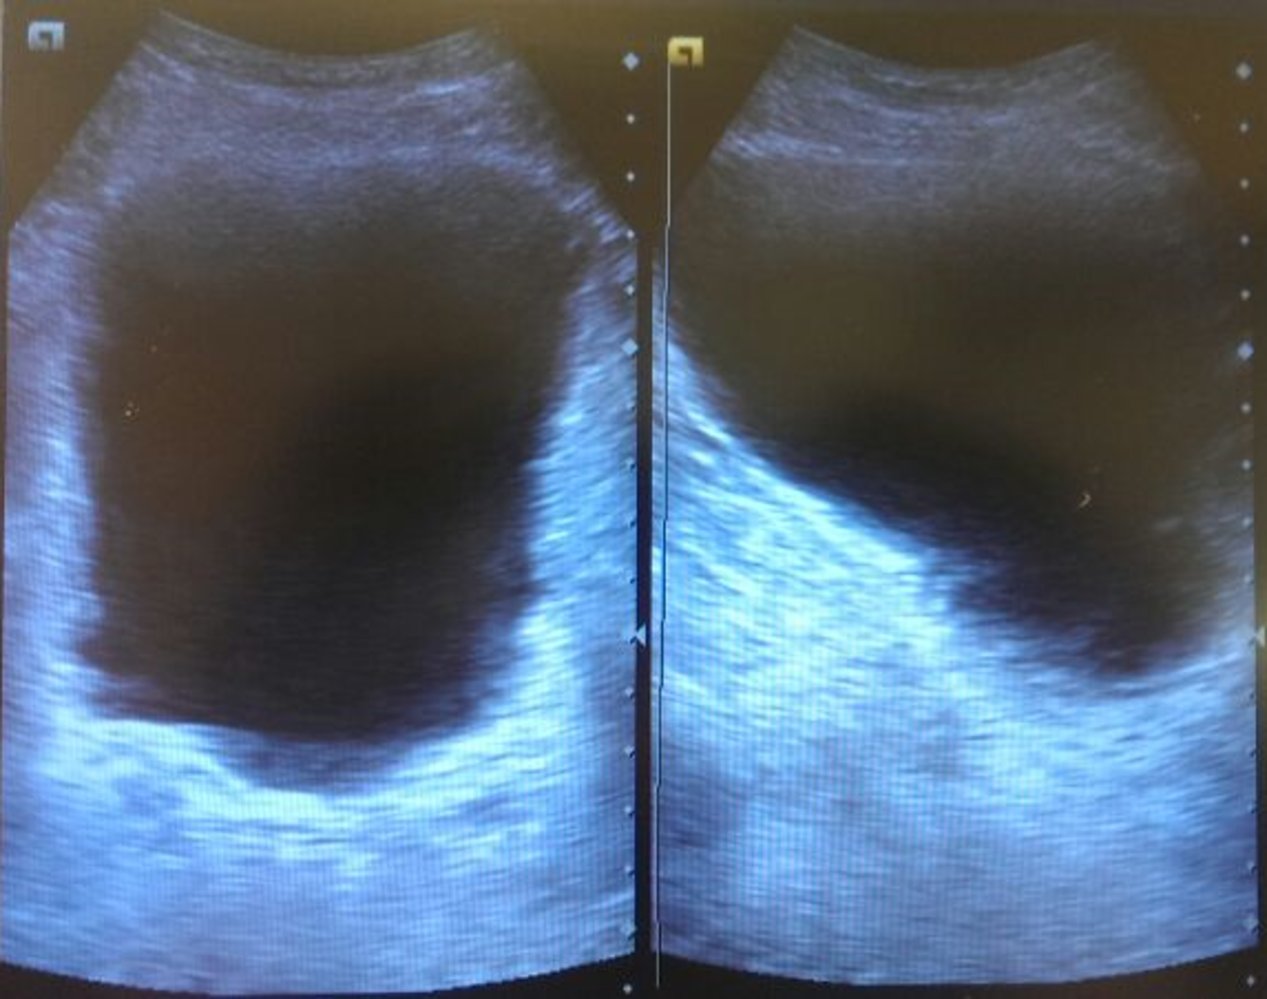
Ultrasound bladder (left: transverse plane; right: longitudinal plane)
Imaging the bladder at its largest diameter in the transverse and longitudinal planes allows for the measurement of bladder length, width, and height (diameter lines) to calculate bladder volume.
© AMBOSS
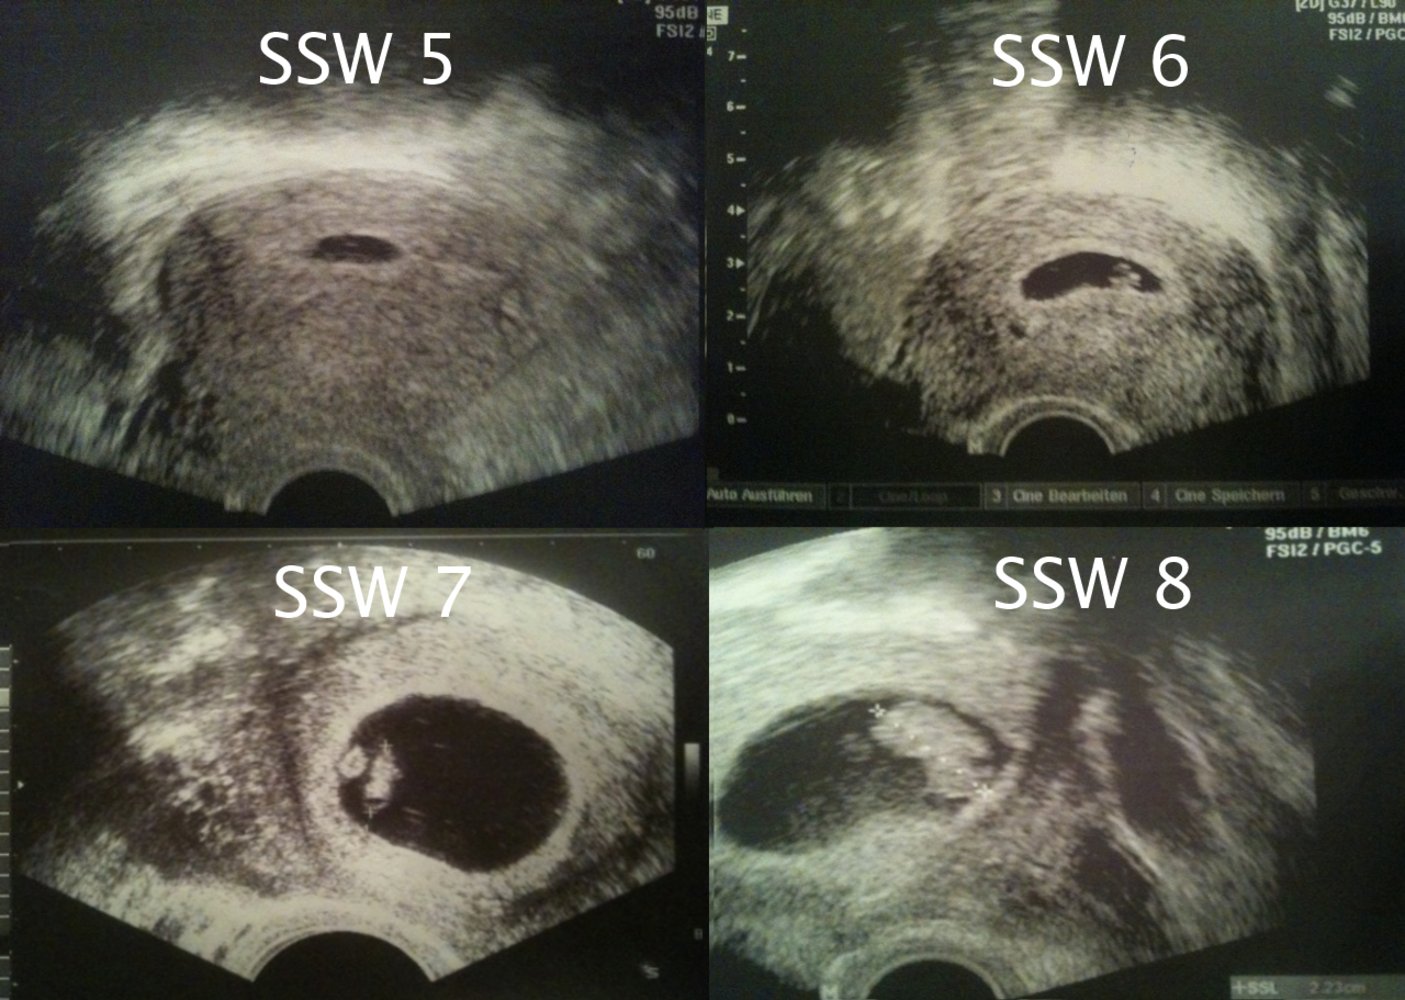
Ultrasound (transabdominal; uterine window) during early weeks of pregnancy
In the eighth week of pregnancy (SSW 8), the crown-rump length (CRL) is at approx. 2.2 cm (normal ~1.7 - 2.3 cm)
© AMBOSS
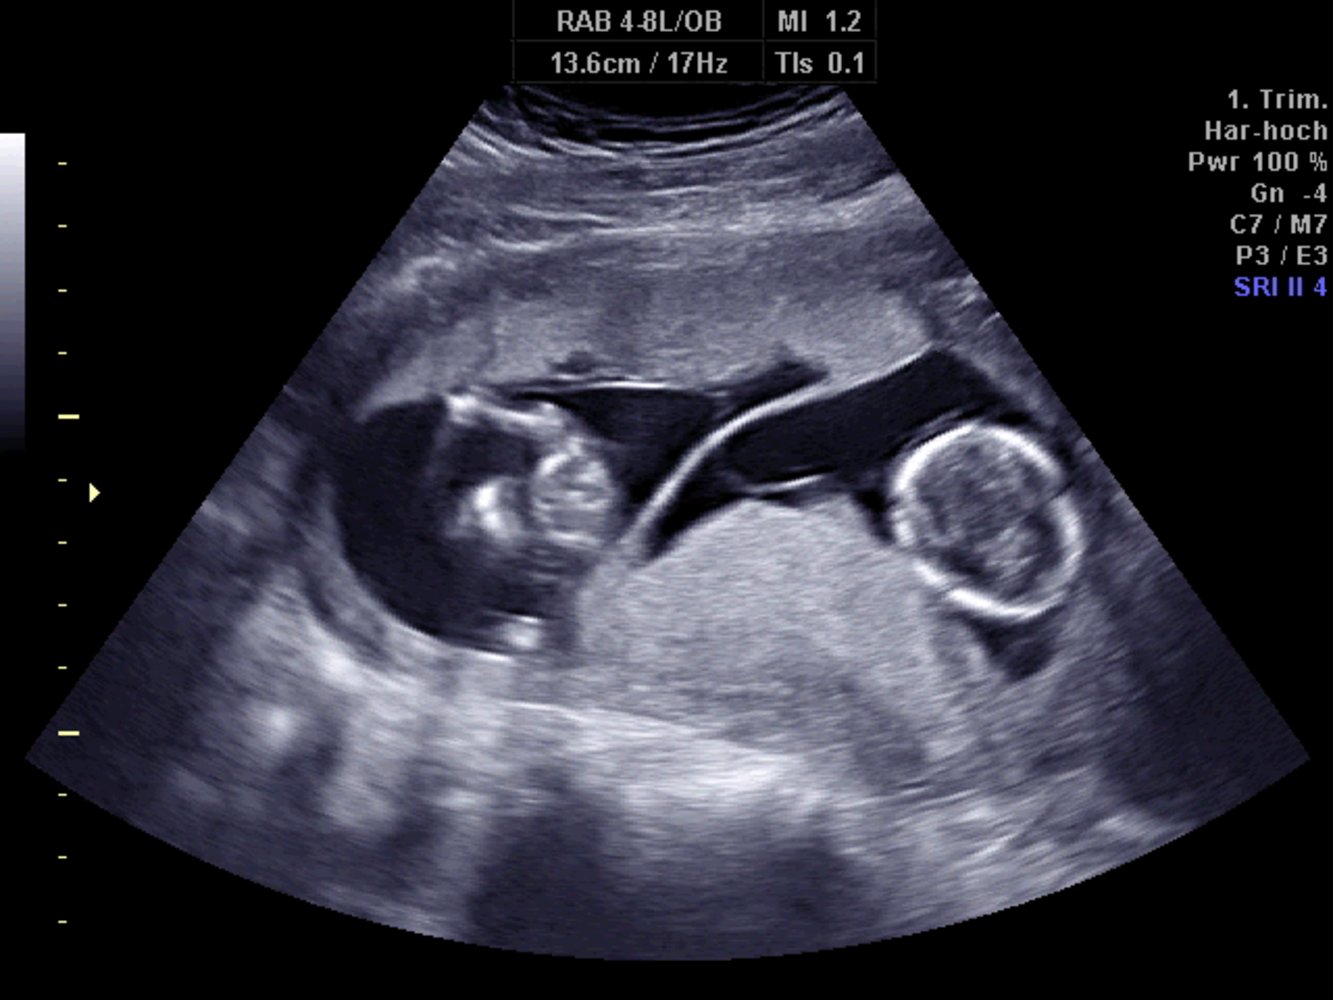
Transabdominal ultrasound of a pregnant patient
A dichorionic diamniotic twin pregnancy in the first trimester is seen. The triangular appearance of the chorion insinuating between layers of the intertwin membrane resembles the Greek letter lambda (λ; blue overlay). The lambda sign (also known as the “twin peak sign”) strongly suggests a dichorionic twin pregnancy.
Green overlay: placenta; red overlay: uterus; yellow overlay: fetus
© AMBOSS
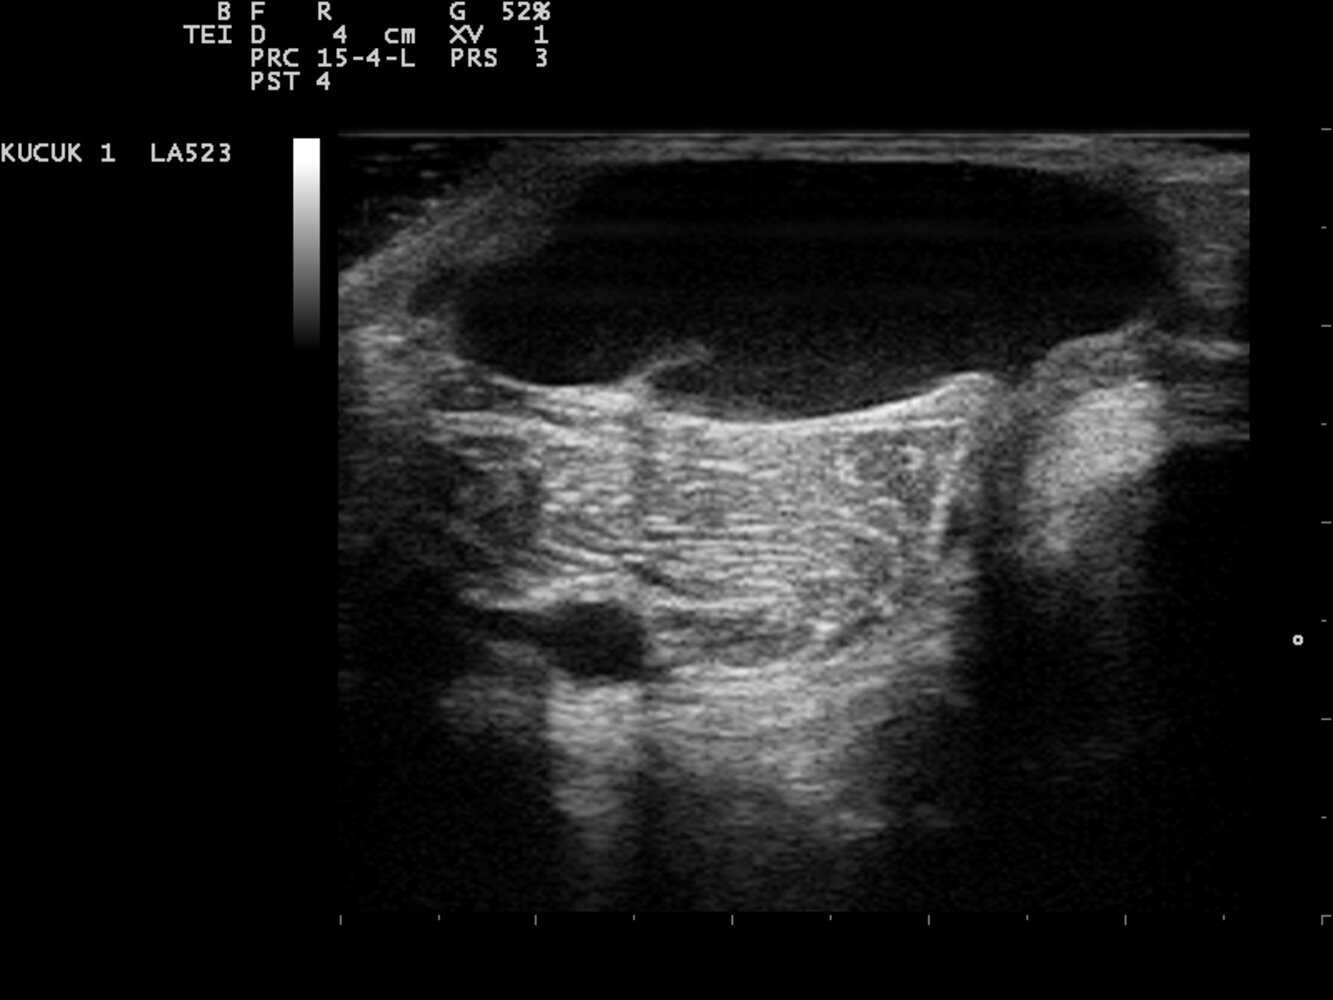
Ultrasound knee (popliteal fossa; transverse plane)
An anechoic structure (popliteal cyst; fluid distension of the gastrocnemius-semimembranosus bursa) is seen in the popliteal fossa. The neck of the cyst courses between the tendon of the semimembranosus muscle and the medial head of the gastrocnemius muscle.
The top of the image is posterior; the right side of the image is medial.
Source: “Ultrasound Scan ND 0125091859 0930200” by Nevit Dilmen, Wikimedia Commons, licensed under CC BY-SA 3.0. The supplementary image with overlays of relevant areas was adapted from the image mentioned above and licensed under CC BY-SA 3.0.

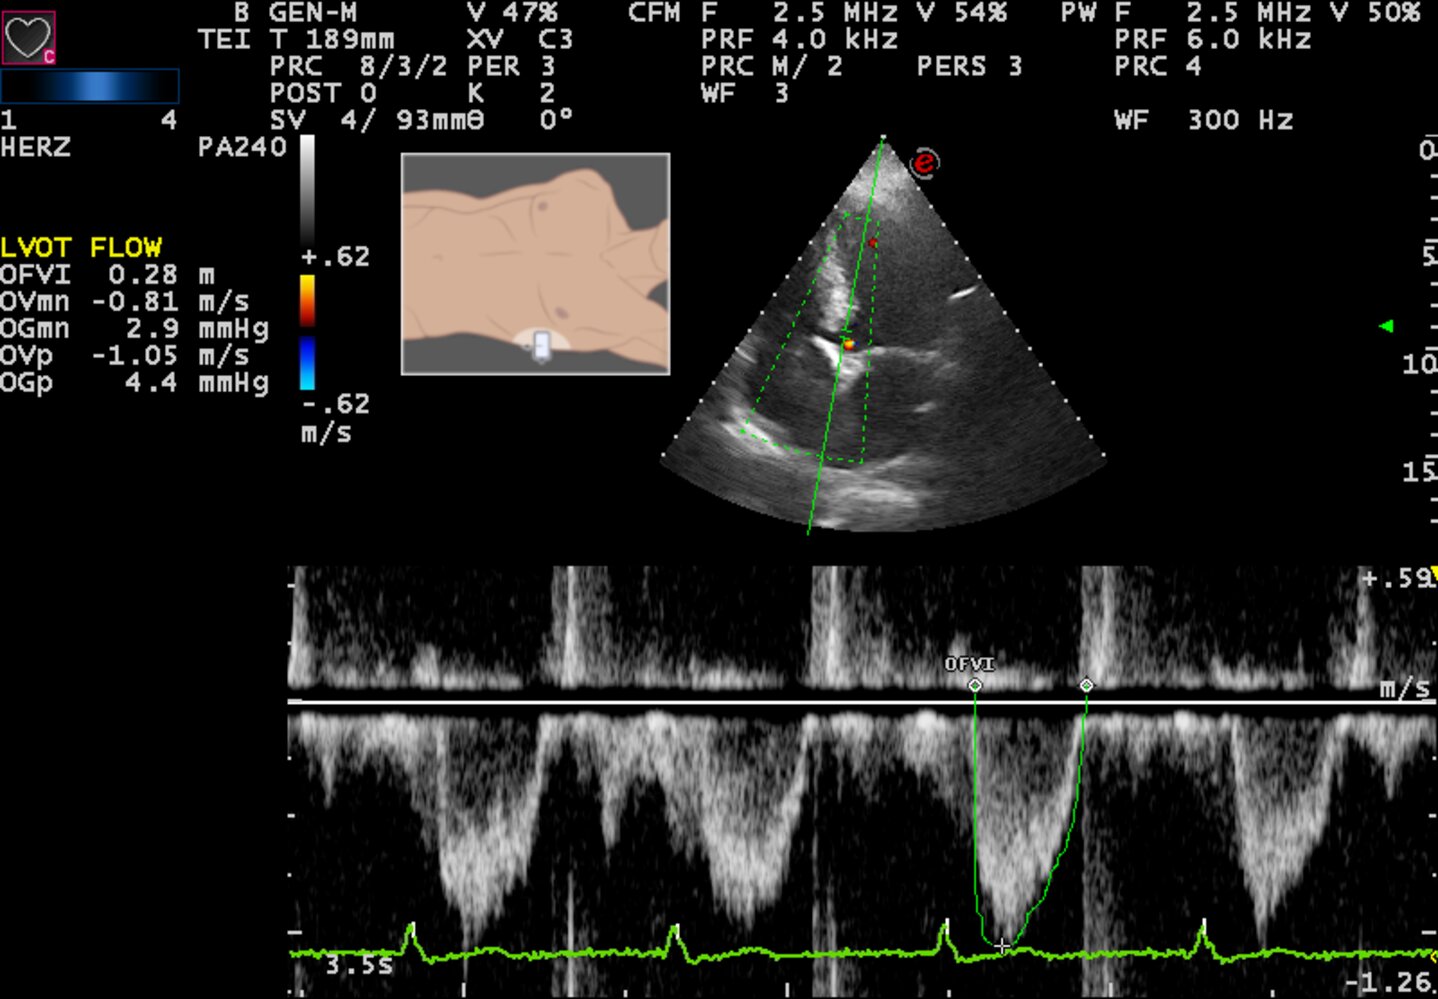
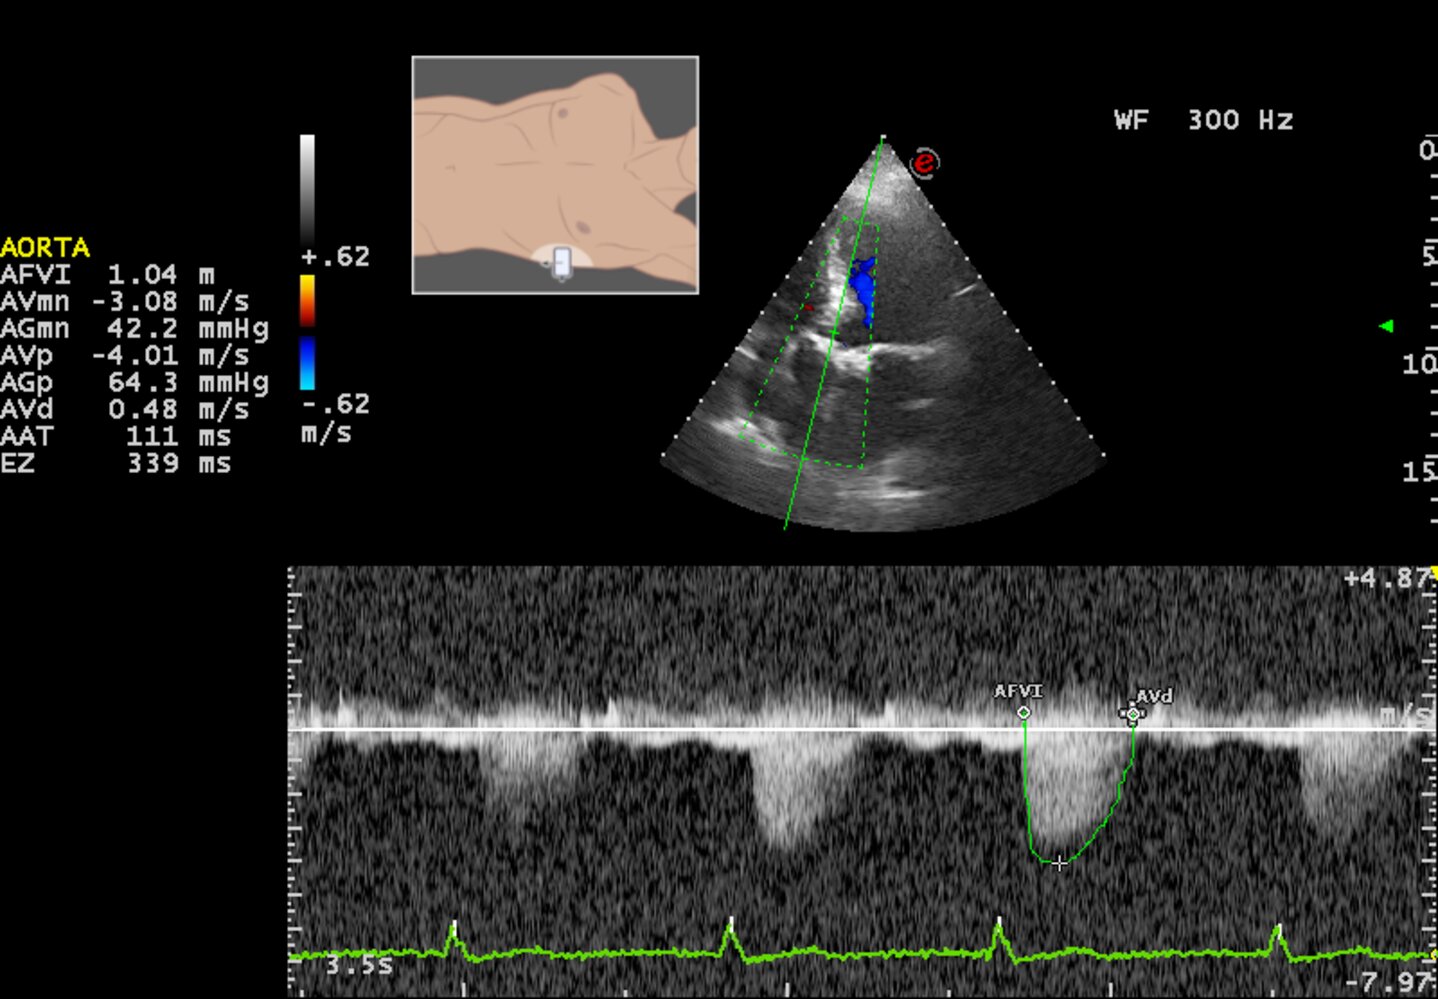
Echocardiography (transthoracic; apical five-chamber view; with CW Doppler)
The aortic valve is hyperechoic due to calcification and fibrosis of the valve leaflets.Transaortic velocity measures 4.01 m/s and the mean aortic pressure gradient measures 42.2 mmHg. From these measurements, the aortic valve stenosis would be classified as stage C2.
Our great thanks to Thomas Vahldieck, MD, for kindly providing this case.
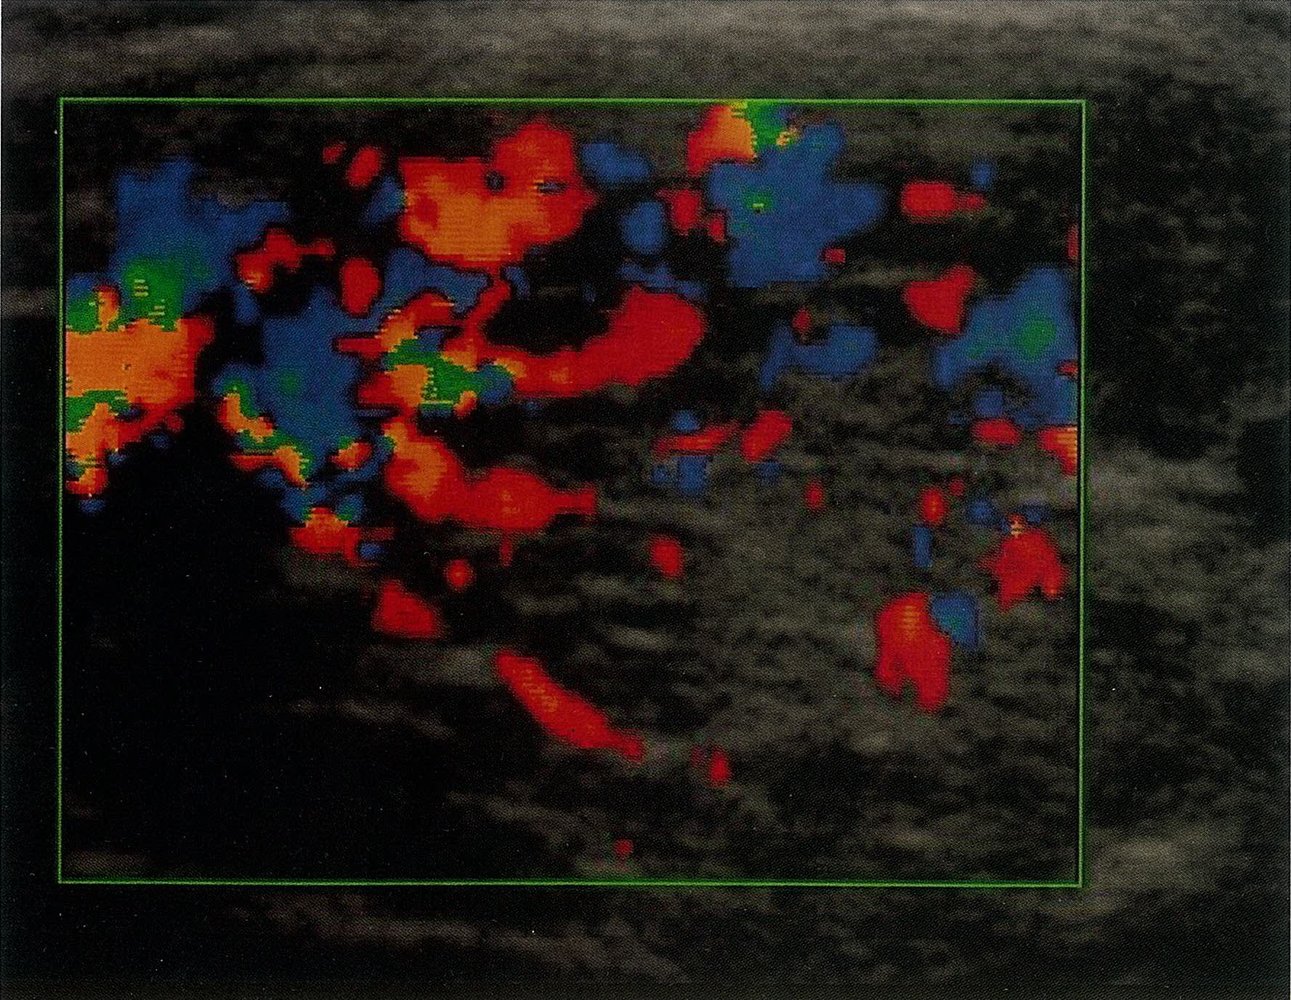
Ultrasound thyroid (color Doppler) of patient with history of Graves disease
The thyroid gland (outline) shows increased color Doppler signal indicating hypervascularity. Visible portions of the gland are heterogeneous and hypoechoic (examples indicated by arrows).
Thyroid gland assessment in Graves disease should be multifactorial, taking into consideration B-mode, spectral, and color Doppler features. Hypervascularity is common in Graves disease but can also be caused by other conditions (e.g., vasculitis, hypothyroidism). The thyroid gland in Graves disease is typically enlarged, hypoechoic, and heterogeneous, with increased color Doppler signal. Peak systolic velocity in the inferior thyroid artery on Doppler spectral analysis is classically higher than in thyroiditis.
Source: © IMPP
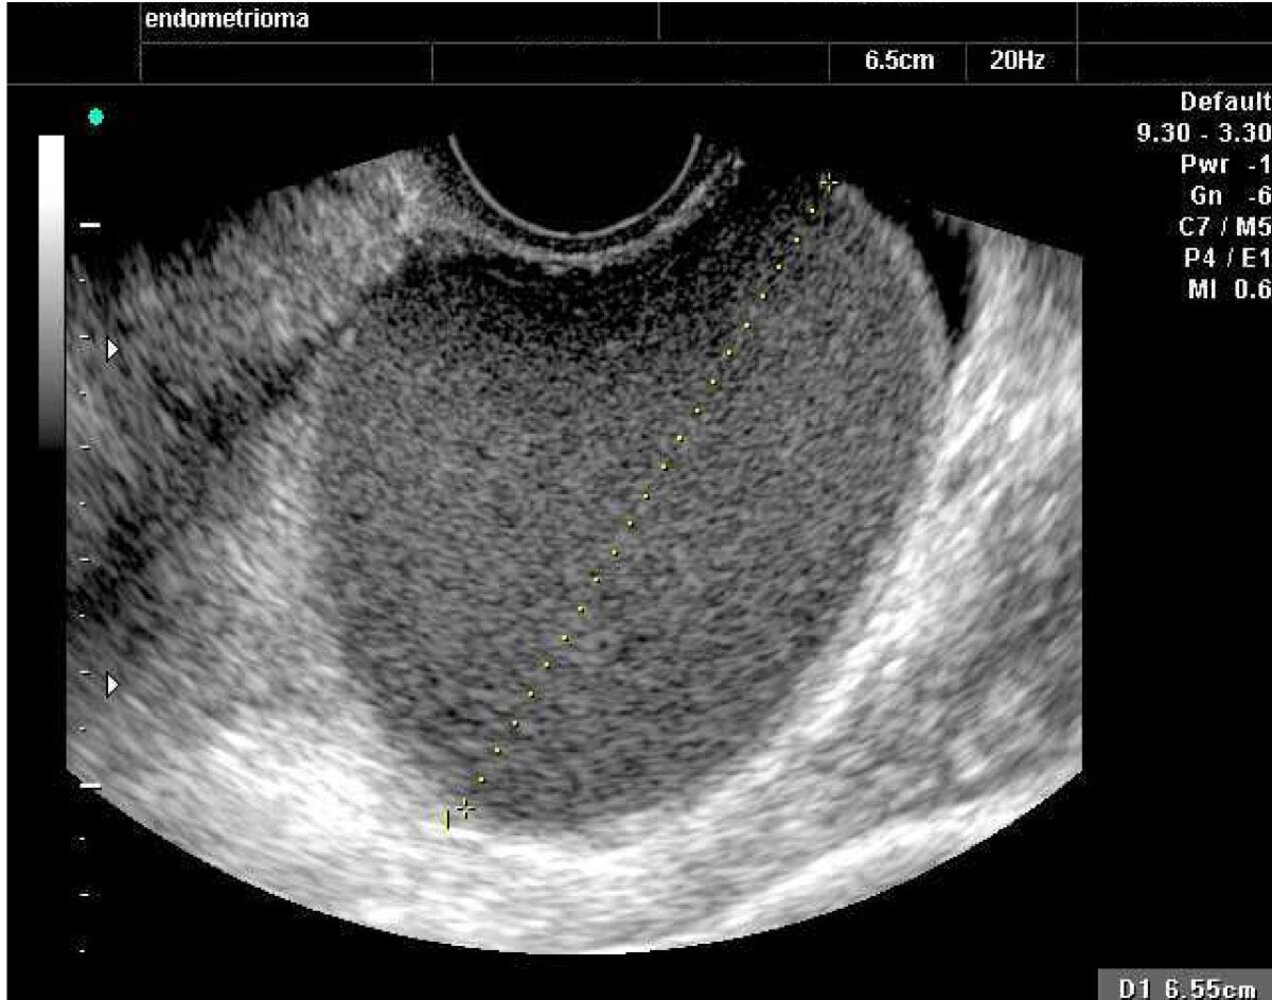
Ultrasound ovary (transvaginal)
A 6.5 cm long unilocular ovarian cyst is filled with low-level echoes, producing a homogeneous, ground-glass appearance. Trace-free fluid is seen next to the cyst (blue overlay).
This appearance is considered typical for an endometrioma, although endometriomas may also be multilocular and show other features, such as echogenic wall foci and fluid-fluid levels. Endometriomas are avascular when imaged with Doppler ultrasound.
T: transducer
Source: “Figure 1. : "Ultrasound imaging of the ovarian cystic lesion." in: Endometriosis in a postmenopausal woman without previous hormonal therapy: a case report:” by Manuel García Manero, Pedro Royo, Begoña Olartecoechea & Juan Luis Alcázar, Journal of Medical Case Reports, licensed under CC BY-SA 4.0. Modifications: Text deleted. The supplementary image with overlays of relevant areas was adapted from the image mentioned above and licensed under CC BY-SA 4.0.
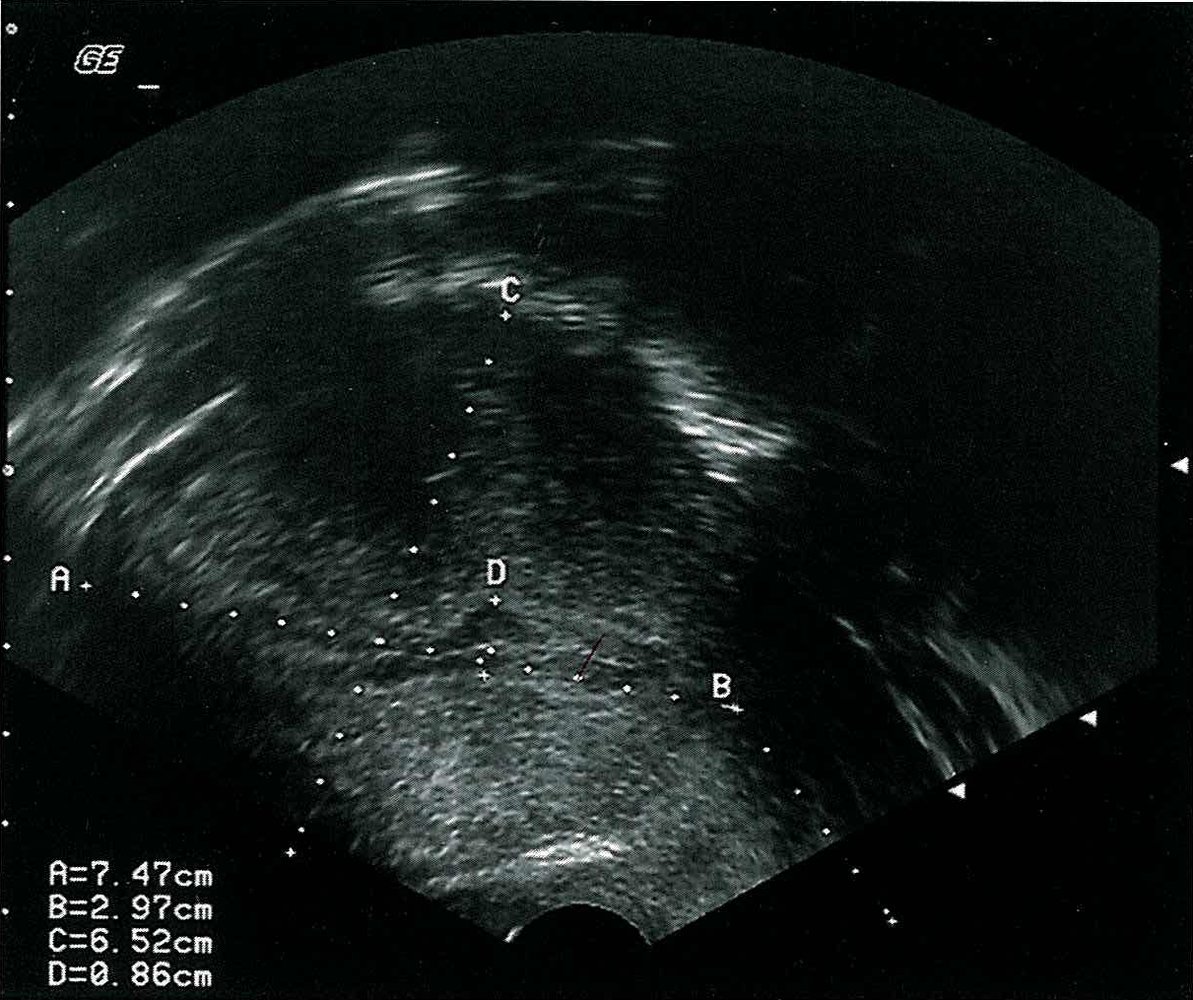
Limited assessment possible as only one image is accessible: This image is of a transvaginal ultrasound, whereby the transducer is positioned near the cervix and the sound waves are sent cranially, resulting in a sagittal section of the uterine corpus (D) and cervix (C). The endometrium (A) lies central in the uterus and is termed endometrial stripe in ultrasound. There are three suspected myomas (B) in the myometrium, with both cranially located myomas heterogeneous and hypoechoic and the myoma at the bottom of the image demonstrating calcifications.
Source: © IMPP
References
- Szabo TL, Lewin PA. "Ultrasound Transducer Selection in Clinical Imaging Practice". Journal of Ultrasound in Medicine. 32(4). :573-582. (2013)
- American Institute of Ultrasound in Medicine, American College of Emergency Physicians. "AIUM Practice Parameter for the Performance of the Focused Assessment with Sonography for Trauma (FAST) Examination.". J Ultrasound Med. 33(11). :2047-56. (2014)
- Carmody K, Moore C, Feller-Kopman D. "Handbook of Critical Care and Emergency Ultrasound". McGraw Hill Professional. (2011). ISBN: 9780071604901